MicrobiomeAnalysis: A comprehensive R package for managing and analyzing microbiome data
Hua Zou
UCASzouhua1@outlook.com
2023-12-04
Source:vignettes/Introduction.Rmd
Introduction.Rmd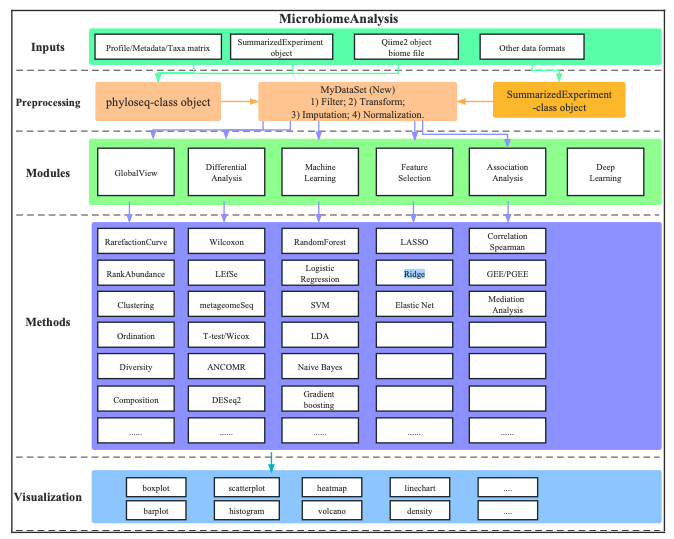
Convert inputs into phyloseq-class object
inputs from dada2
seq_tab <- readRDS(
  system.file("extdata", "dada2_seqtab.rds",
     package = "MicrobiomeAnalysis"))

tax_tab <- readRDS(
  system.file("extdata", "dada2_taxtab.rds",
    package = "MicrobiomeAnalysis"))

sam_tab <- read.table(
  system.file("extdata", "dada2_samdata.txt",
     package = "MicrobiomeAnalysis"),
  sep = "\t", header = TRUE, row.names = 1)

ps <- import_dada2(seq_tab = seq_tab,
                   tax_tab = tax_tab,
                   sam_tab = sam_tab)

ps
## phyloseq-class experiment-level object
## otu_table() OTU Table: [ 232 taxa and 20 samples ]
## sample_data() Sample Data: [ 20 samples by 4 sample variables ]
## tax_table() Taxonomy Table: [ 232 taxa by 6 taxonomic ranks ]
## refseq() DNAStringSet: [ 232 reference sequences ]inputs from qiime2
otuqza_file <- system.file(
     "extdata", "table.qza",
     package = "MicrobiomeAnalysis")

taxaqza_file <- system.file(
     "extdata", "taxonomy.qza",
     package = "MicrobiomeAnalysis")

sample_file <- system.file(
     "extdata", "sample-metadata.tsv",
     package = "MicrobiomeAnalysis")

treeqza_file <- system.file(
     "extdata", "tree.qza",
     package = "MicrobiomeAnalysis")

ps_object <- import_qiime2(
     otu_qza = otuqza_file,
     taxa_qza = taxaqza_file,
     sam_tab = sample_file,
     tree_qza = treeqza_file)
ps_object
## phyloseq-class experiment-level object
## otu_table() OTU Table: [ 770 taxa and 34 samples ]
## sample_data() Sample Data: [ 34 samples by 9 sample variables ]
## tax_table() Taxonomy Table: [ 770 taxa by 7 taxonomic ranks ]
## phy_tree() Phylogenetic Tree: [ 770 tips and 768 internal nodes ]Data Processing
Extract specific levels phyloseq-class object
- Extracting “Genus” levels phyloseq object
ps_genus <- aggregate_taxa(ps_object,
                           level = "Genus")
ps_genus
## phyloseq-class experiment-level object
## otu_table() OTU Table: [ 277 taxa and 34 samples ]
## sample_data() Sample Data: [ 34 samples by 9 sample variables ]
## tax_table() Taxonomy Table: [ 277 taxa by 7 taxonomic ranks ]
head(ps_genus@otu_table@.Data, 3)## L1S105 L1S140 L1S208 L1S257 L1S281 L1S57 L1S76
## g__Candidatus_Nitrososphaera 0 0 0 0 0 0 0
## g__Ellin6075_unclassified 0 0 0 0 0 0 0
## g__Acidimicrobiales_unclassified 0 0 0 0 0 0 0
## L1S8 L2S155 L2S175 L2S204 L2S222 L2S240 L2S309
## g__Candidatus_Nitrososphaera 0 0 0 0 0 0 0
## g__Ellin6075_unclassified 0 0 0 0 0 0 0
## g__Acidimicrobiales_unclassified 0 0 0 0 0 0 0
## L2S357 L2S382 L3S242 L3S294 L3S313 L3S341
## g__Candidatus_Nitrososphaera 0 0 0 0 0 0
## g__Ellin6075_unclassified 0 0 0 0 0 0
## g__Acidimicrobiales_unclassified 0 0 0 0 0 0
## L3S360 L3S378 L4S112 L4S137 L4S63 L5S104
## g__Candidatus_Nitrososphaera 0 0 4 0 8 0
## g__Ellin6075_unclassified 0 0 6 0 13 0
## g__Acidimicrobiales_unclassified 0 0 0 0 4 0
## L5S155 L5S174 L5S203 L5S222 L5S240 L6S20 L6S68
## g__Candidatus_Nitrososphaera 0 0 0 0 0 0 0
## g__Ellin6075_unclassified 0 0 0 0 0 0 0
## g__Acidimicrobiales_unclassified 0 0 0 0 0 0 0
## L6S93
## g__Candidatus_Nitrososphaera 0
## g__Ellin6075_unclassified 0
## g__Acidimicrobiales_unclassified 0Summarize the specific taxonomic levels
- Phyloseq object contains from Kingdom to the the specific taxonomic levels (Phylum)
ps_summarize_genus <- summarize_taxa(
    ps_object,
    level = "Genus")
ps_summarize_genus
## phyloseq-class experiment-level object
## otu_table() OTU Table: [ 628 taxa and 34 samples ]
## sample_data() Sample Data: [ 34 samples by 9 sample variables ]
## tax_table() Taxonomy Table: [ 628 taxa by 1 taxonomic ranks ]Data Transformation
- Transform the taxa abundances in
otu_table, which applying a mathematical transformation on individual values themselves.
ps_genus_transform <- transform_abundances(
    object = ps_genus,
    transform = "log10p")

head(ps_genus_transform@otu_table@.Data, 3)
## L1S105 L1S140 L1S208 L1S257 L1S281 L1S57 L1S76
## g__Candidatus_Nitrososphaera 0 0 0 0 0 0 0
## g__Ellin6075_unclassified 0 0 0 0 0 0 0
## g__Acidimicrobiales_unclassified 0 0 0 0 0 0 0
## L1S8 L2S155 L2S175 L2S204 L2S222 L2S240 L2S309
## g__Candidatus_Nitrososphaera 0 0 0 0 0 0 0
## g__Ellin6075_unclassified 0 0 0 0 0 0 0
## g__Acidimicrobiales_unclassified 0 0 0 0 0 0 0
## L2S357 L2S382 L3S242 L3S294 L3S313 L3S341
## g__Candidatus_Nitrososphaera 0 0 0 0 0 0
## g__Ellin6075_unclassified 0 0 0 0 0 0
## g__Acidimicrobiales_unclassified 0 0 0 0 0 0
## L3S360 L3S378 L4S112 L4S137 L4S63 L5S104
## g__Candidatus_Nitrososphaera 0 0 0.6020600 0 0.903090 0
## g__Ellin6075_unclassified 0 0 0.7781513 0 1.113943 0
## g__Acidimicrobiales_unclassified 0 0 0.0000000 0 0.602060 0
## L5S155 L5S174 L5S203 L5S222 L5S240 L6S20 L6S68
## g__Candidatus_Nitrososphaera 0 0 0 0 0 0 0
## g__Ellin6075_unclassified 0 0 0 0 0 0 0
## g__Acidimicrobiales_unclassified 0 0 0 0 0 0 0
## L6S93
## g__Candidatus_Nitrososphaera 0
## g__Ellin6075_unclassified 0
## g__Acidimicrobiales_unclassified 0Data Imputation
- Imputing missing value of OTU_table in phyloseq-class object
ps_genus_impute <- impute_abundance(
    object = ps_genus,
    group = "body.site",
    ZerosAsNA = TRUE,
    RemoveNA = TRUE,
    cutoff = 20,
    method = "half_min")

head(ps_genus_impute@otu_table@.Data, 3)
## L1S105 L1S140 L1S208 L1S257 L1S281 L1S57 L1S76 L1S8 L2S155
## g__Corynebacterium 1.5 7 1.5 1.5 1.5 1.5 1.5 1.5 1156
## g__Rothia 2.0 2 2.0 2.0 2.0 2.0 2.0 2.0 11
## g__Propionibacterium 1.0 1 1.0 1.0 1.0 1.0 1.0 1.0 7
## L2S175 L2S204 L2S222 L2S240 L2S309 L2S357 L2S382 L3S242
## g__Corynebacterium 1367 106 164 29 152 345 285 1.5
## g__Rothia 52 16 4 178 12 22 37 2.0
## g__Propionibacterium 31 3 7 1 31 18 35 1.0
## L3S294 L3S313 L3S341 L3S360 L3S378 L4S112 L4S137 L4S63
## g__Corynebacterium 424 340 43 51 1.5 1007 943 1109
## g__Rothia 9 19 4 2 2.0 82 82 48
## g__Propionibacterium 7 11 2 1 1.0 87 25 106
## L5S104 L5S155 L5S174 L5S203 L5S222 L5S240 L6S20 L6S68
## g__Corynebacterium 1.5 1.5 1.5 3 1.5 1.5 1.5 1.5
## g__Rothia 178.0 64.0 45.0 83 31.0 104.0 108.0 224.0
## g__Propionibacterium 1.0 1.0 1.0 1 1.0 1.0 1.0 1.0
## L6S93
## g__Corynebacterium 1.5
## g__Rothia 38.0
## g__Propionibacterium 1.0Data Normalization
- Normalizing the OTU_table in phyloseq-class object sample by sample to reduce the effects of systematic differences such as library size.
ps_genus_norm <- normalize(
    object = ps_genus,
    method = "TSS")

head(ps_genus_norm@otu_table@.Data, 3)
## L1S105 L1S140 L1S208 L1S257 L1S281 L1S57 L1S76
## g__Candidatus_Nitrososphaera 0 0 0 0 0 0 0
## g__Ellin6075_unclassified 0 0 0 0 0 0 0
## g__Acidimicrobiales_unclassified 0 0 0 0 0 0 0
## L1S8 L2S155 L2S175 L2S204 L2S222 L2S240 L2S309
## g__Candidatus_Nitrososphaera 0 0 0 0 0 0 0
## g__Ellin6075_unclassified 0 0 0 0 0 0 0
## g__Acidimicrobiales_unclassified 0 0 0 0 0 0 0
## L2S357 L2S382 L3S242 L3S294 L3S313 L3S341
## g__Candidatus_Nitrososphaera 0 0 0 0 0 0
## g__Ellin6075_unclassified 0 0 0 0 0 0
## g__Acidimicrobiales_unclassified 0 0 0 0 0 0
## L3S360 L3S378 L4S112 L4S137 L4S63
## g__Candidatus_Nitrososphaera 0 0 0.0004796163 0 0.0008210181
## g__Ellin6075_unclassified 0 0 0.0007194245 0 0.0013341544
## g__Acidimicrobiales_unclassified 0 0 0.0000000000 0 0.0004105090
## L5S104 L5S155 L5S174 L5S203 L5S222 L5S240
## g__Candidatus_Nitrososphaera 0 0 0 0 0 0
## g__Ellin6075_unclassified 0 0 0 0 0 0
## g__Acidimicrobiales_unclassified 0 0 0 0 0 0
## L6S20 L6S68 L6S93
## g__Candidatus_Nitrososphaera 0 0 0
## g__Ellin6075_unclassified 0 0 0
## g__Acidimicrobiales_unclassified 0 0 0Data Scaling
- Data scaling adjusts each variable/feature by a scaling factor computed based on the dispersion of the variable.
ps_genus_scale <- scale_variables(
    object = ps_genus,
    method = "zscore")

head(ps_genus_scale@otu_table@.Data, 3)
## L1S105 L1S140 L1S208 L1S257
## g__Candidatus_Nitrososphaera -0.2329302 -0.2329302 -0.2329302 -0.2329302
## g__Ellin6075_unclassified -0.2302519 -0.2302519 -0.2302519 -0.2302519
## g__Acidimicrobiales_unclassified -0.1714986 -0.1714986 -0.1714986 -0.1714986
## L1S281 L1S57 L1S76 L1S8
## g__Candidatus_Nitrososphaera -0.2329302 -0.2329302 -0.2329302 -0.2329302
## g__Ellin6075_unclassified -0.2302519 -0.2302519 -0.2302519 -0.2302519
## g__Acidimicrobiales_unclassified -0.1714986 -0.1714986 -0.1714986 -0.1714986
## L2S155 L2S175 L2S204 L2S222
## g__Candidatus_Nitrososphaera -0.2329302 -0.2329302 -0.2329302 -0.2329302
## g__Ellin6075_unclassified -0.2302519 -0.2302519 -0.2302519 -0.2302519
## g__Acidimicrobiales_unclassified -0.1714986 -0.1714986 -0.1714986 -0.1714986
## L2S240 L2S309 L2S357 L2S382
## g__Candidatus_Nitrososphaera -0.2329302 -0.2329302 -0.2329302 -0.2329302
## g__Ellin6075_unclassified -0.2302519 -0.2302519 -0.2302519 -0.2302519
## g__Acidimicrobiales_unclassified -0.1714986 -0.1714986 -0.1714986 -0.1714986
## L3S242 L3S294 L3S313 L3S341
## g__Candidatus_Nitrososphaera -0.2329302 -0.2329302 -0.2329302 -0.2329302
## g__Ellin6075_unclassified -0.2302519 -0.2302519 -0.2302519 -0.2302519
## g__Acidimicrobiales_unclassified -0.1714986 -0.1714986 -0.1714986 -0.1714986
## L3S360 L3S378 L4S112 L4S137
## g__Candidatus_Nitrososphaera -0.2329302 -0.2329302 2.4069456 -0.2329302
## g__Ellin6075_unclassified -0.2302519 -0.2302519 2.2419265 -0.2302519
## g__Acidimicrobiales_unclassified -0.1714986 -0.1714986 -0.1714986 -0.1714986
## L4S63 L5S104 L5S155 L5S174
## g__Candidatus_Nitrososphaera 5.046821 -0.2329302 -0.2329302 -0.2329302
## g__Ellin6075_unclassified 5.126135 -0.2302519 -0.2302519 -0.2302519
## g__Acidimicrobiales_unclassified 5.659453 -0.1714986 -0.1714986 -0.1714986
## L5S203 L5S222 L5S240 L6S20
## g__Candidatus_Nitrososphaera -0.2329302 -0.2329302 -0.2329302 -0.2329302
## g__Ellin6075_unclassified -0.2302519 -0.2302519 -0.2302519 -0.2302519
## g__Acidimicrobiales_unclassified -0.1714986 -0.1714986 -0.1714986 -0.1714986
## L6S68 L6S93
## g__Candidatus_Nitrososphaera -0.2329302 -0.2329302
## g__Ellin6075_unclassified -0.2302519 -0.2302519
## g__Acidimicrobiales_unclassified -0.1714986 -0.1714986Data Trimming
- Trimming samples or taxa whose prevalence is less than threshold
ps_genus_trim <- trim_prevalence(
    object = ps_genus,
    level = NULL,
    cutoff = 0.1,
    trim = "feature")

ps_genus_trim
## phyloseq-class experiment-level object
## otu_table() OTU Table: [ 114 taxa and 34 samples ]
## sample_data() Sample Data: [ 34 samples by 9 sample variables ]
## tax_table() Taxonomy Table: [ 114 taxa by 7 taxonomic ranks ]
head(ps_genus_trim@otu_table@.Data, 3)## L1S105 L1S140 L1S208 L1S257 L1S281 L1S57 L1S76 L1S8 L2S155
## g__Actinomyces 0 0 0 0 0 0 0 0 0
## g__Corynebacterium 0 7 0 0 0 0 0 0 1156
## g__Rothia 0 0 0 0 0 0 0 0 11
## L2S175 L2S204 L2S222 L2S240 L2S309 L2S357 L2S382 L3S242
## g__Actinomyces 0 0 0 27 0 0 7 0
## g__Corynebacterium 1367 106 164 29 152 345 285 0
## g__Rothia 52 16 4 178 12 22 37 0
## L3S294 L3S313 L3S341 L3S360 L3S378 L4S112 L4S137 L4S63
## g__Actinomyces 0 0 0 0 0 13 30 7
## g__Corynebacterium 424 340 43 51 0 1007 943 1109
## g__Rothia 9 19 4 0 0 82 82 48
## L5S104 L5S155 L5S174 L5S203 L5S222 L5S240 L6S20 L6S68 L6S93
## g__Actinomyces 28 0 37 21 13 0 92 34 14
## g__Corynebacterium 0 0 0 3 0 0 0 0 0
## g__Rothia 178 64 45 83 31 104 108 224 38Data Filtering
-
Filtering taxa who is low relative abundance or unclassified (Ref: (Thingholm et al. 2019))
Taxa more than Mean relative abundance across all samples: 100;
Taxa more than Minimum relative abundance at least one sample: 1000.
ps_genus_filter <- filter_abundance(
    object = ps_genus,
    level = NULL,
    cutoff_mean = 100,
    cutoff_one = 1000,
    unclass = TRUE)

ps_genus_filter
## phyloseq-class experiment-level object
## otu_table() OTU Table: [ 7 taxa and 34 samples ]
## sample_data() Sample Data: [ 34 samples by 9 sample variables ]
## tax_table() Taxonomy Table: [ 7 taxa by 7 taxonomic ranks ]
head(ps_genus_filter@otu_table@.Data, 3)## L1S105 L1S140 L1S208 L1S257 L1S281 L1S57 L1S76 L1S8 L2S155
## g__Bacteroides 4521 4613 4569 3016 3078 4555 4824 4568 10
## g__Corynebacterium 0 7 0 0 0 0 0 0 1156
## g__Haemophilus 0 0 5 0 0 0 0 5 37
## L2S175 L2S204 L2S222 L2S240 L2S309 L2S357 L2S382 L3S242
## g__Bacteroides 10 31 52 3 32 14 0 625
## g__Corynebacterium 1367 106 164 29 152 345 285 0
## g__Haemophilus 95 20 15 1181 45 98 119 5
## L3S294 L3S313 L3S341 L3S360 L3S378 L4S112 L4S137 L4S63
## g__Bacteroides 0 6 11 13 763 64 5 24
## g__Corynebacterium 424 340 43 51 0 1007 943 1109
## g__Haemophilus 14 16 56 0 0 311 681 125
## L5S104 L5S155 L5S174 L5S203 L5S222 L5S240 L6S20 L6S68 L6S93
## g__Bacteroides 10 9 0 5 0 10 8 5 9
## g__Corynebacterium 0 0 0 3 0 0 0 0 0
## g__Haemophilus 529 453 254 357 390 532 940 1291 724Multivariate Community Analysis
Know more details of the aftermentioned statistical methods to see (Xia et al. 2018).
Multivariate homogeneity of groups dispersions (variances)
(Anderson, Ellingsen, and McArdle 2006)
run_betadisper(object = ps_object,
               level = "Genus",
               variable = "body.site",
               method = "bray")
##
## Permutation test for homogeneity of multivariate dispersions
## Permutation: free
## Number of permutations: 999
##
## Response: Distances
## Df Sum Sq Mean Sq F N.Perm Pr(>F)
## Groups 3 0.30323 0.101077 13.08 999 0.002 **
## Residuals 30 0.23184 0.007728
## ---
## Signif. codes: 0 '***' 0.001 '**' 0.01 '*' 0.05 '.' 0.1 ' ' 1
##
## Pairwise comparisons:
## (Observed p-value below diagonal, permuted p-value above diagonal)
## gut left palm right palm tongue
## gut 2.0000e-02 1.0000e-03 0.341
## left palm 1.4486e-02 9.3000e-02 0.013
## right palm 1.6126e-05 8.7427e-02 0.001
## tongue 3.3527e-01 9.9835e-03 6.9602e-05Permutational Multivariate Analysis of Variance (PERMANOVA)
(Anderson 2014)
run_PERMANOVA(object = ps_object,
              level = NULL,
              method = "bray")
## SumsOfSample Df SumsOfSqs MeanSqs F.Model
## sample.id 34 33 12.9821194 0.3933976 0.0000000
## barcode.sequence 34 33 12.9821194 0.3933976 0.0000000
## body.site 34 3 5.1920140 1.7306713 6.6648828
## year 34 1 0.5744677 0.5744677 1.4815830
## month 34 4 1.3733243 0.3433311 0.8576774
## day 34 3 1.1036246 0.3678749 0.9290946
## subject 34 1 0.7852501 0.7852501 2.0602011
## reported.antibiotic.usage 34 1 0.5744677 0.5744677 1.4815830
## days.since.experiment.start 34 4 1.3733243 0.3433311 0.8576774
## R2 Pr(>F) AdjustedPvalue
## sample.id 1.00000000 1.000 1.0000000
## barcode.sequence 1.00000000 1.000 1.0000000
## body.site 0.39993577 0.001 0.0090000
## year 0.04425069 0.126 0.2835000
## month 0.10578584 0.723 0.9295714
## day 0.08501112 0.532 0.9295714
## subject 0.06048705 0.052 0.2340000
## reported.antibiotic.usage 0.04425069 0.116 0.2835000
## days.since.experiment.start 0.10578584 0.718 0.9295714Mantel Test (MANTEL)
(Mantel 1967)
run_MANTEL(object = ps_object,
           y_variables = "body.site",
           z_variables = c("subject", "reported.antibiotic.usage"),
           norm = FALSE,
           method = "mantel.partial",
           method_dist = c("bray", "euclidean", "jaccard"))
##
## Partial Mantel statistic based on Spearman's rank correlation rho
##
## Call:
## vegan::mantel.partial(xdis = x_dis, ydis = y_dis, zdis = z_dis, method = method_cor, permutations = 999)
##
## Mantel statistic r: 0.563
## Significance: 0.001
##
## Upper quantiles of permutations (null model):
## 90% 95% 97.5% 99%
## 0.0578 0.0779 0.0994 0.1285
## Permutation: free
## Number of permutations: 999Analysis of Similarity (ANOSIM)
(Clarke 1993)
run_ANOSIM(object = ps_object,
           level = "Genus",
           variable = "body.site",
           method = "bray")
##
## Call:
## vegan::anosim(x = dis, grouping = datphe, permutations = 999)
## Dissimilarity: bray
##
## ANOSIM statistic R: 0.6855
## Significance: 0.001
##
## Permutation: free
## Number of permutations: 999Multi-response Permutation Procedures (MRPP)
(Mielke Jr 1991)
run_MRPP(object = ps_object,
         level = "Genus",
         variable = "body.site",
         method = "bray")
##
## Call:
## vegan::mrpp(dat = dis, grouping = datphe, permutations = 999)
##
## Dissimilarity index: bray
## Weights for groups: n
##
## Class means and counts:
##
## gut left palm right palm tongue
## delta 0.5657 0.7732 0.8839 0.5273
## n 8 8 9 9
##
## Chance corrected within-group agreement A: 0.2085
## Based on observed delta 0.6886 and expected delta 0.8699
##
## Significance of delta: 0.001
## Permutation: free
## Number of permutations: 999Alpha diversity
- calculating alpha diversity index on microbiota data
alphaindex <- get_alphaindex(
  ps = ps_object,
  level = "Genus",
  indices = c("Shannon", "Chao1"))

head(alphaindex)
## sample.id barcode.sequence body.site year month day subject
## L1S105 L1S105 AGTGCGATGCGT gut 2009 3 17 subject-1
## L1S140 L1S140 ATGGCAGCTCTA gut 2008 10 28 subject-2
## L1S208 L1S208 CTGAGATACGCG gut 2009 1 20 subject-2
## L1S257 L1S257 CCGACTGAGATG gut 2009 3 17 subject-2
## L1S281 L1S281 CCTCTCGTGATC gut 2009 4 14 subject-2
## L1S57 L1S57 ACACACTATGGC gut 2009 1 20 subject-1
## reported.antibiotic.usage days.since.experiment.start Chao1 Shannon
## L1S105 No 140 29 1.715803
## L1S140 Yes 0 30 1.582306
## L1S208 No 84 38 1.899839
## L1S257 No 140 37 2.098328
## L1S281 No 168 32 2.031926
## L1S57 No 84 28 1.910027Beta dispersion
- Permutation test for homogeneity of multivariate dispersions on microbiota data
data("Zeybel_2022_gut")

run_betadisper(
  object = Zeybel_2022_gut,
  level = "Phylum",
  variable = "LiverFatClass",
  method = "bray")
##
## Permutation test for homogeneity of multivariate dispersions
## Permutation: free
## Number of permutations: 999
##
## Response: Distances
## Df Sum Sq Mean Sq F N.Perm Pr(>F)
## Groups 3 0.07567 0.025223 0.7859 999 0.531
## Residuals 38 1.21960 0.032095
##
## Pairwise comparisons:
## (Observed p-value below diagonal, permuted p-value above diagonal)
## Mild Moderate None Severe
## Mild 0.360000 0.085000 0.494
## Moderate 0.349179 0.296000 0.866
## None 0.075632 0.292971 0.660
## Severe 0.465765 0.841449 0.642257Beta diversity
- Principal Coordinate Analysis
data("Zeybel_2022_gut")
ps_zeybel <- summarize_taxa(Zeybel_2022_gut, level = "Genus")

ord_result <- run_ord(
  object = ps_zeybel,
  variable = "LiverFatClass",
  method = "PCoA")

plot_ord(
  reslist = ord_result,
  variable = "LiverFatClass",
  ellipse_type = "ellipse_groups",
  sideboxplot = TRUE,
  sample_label = FALSE)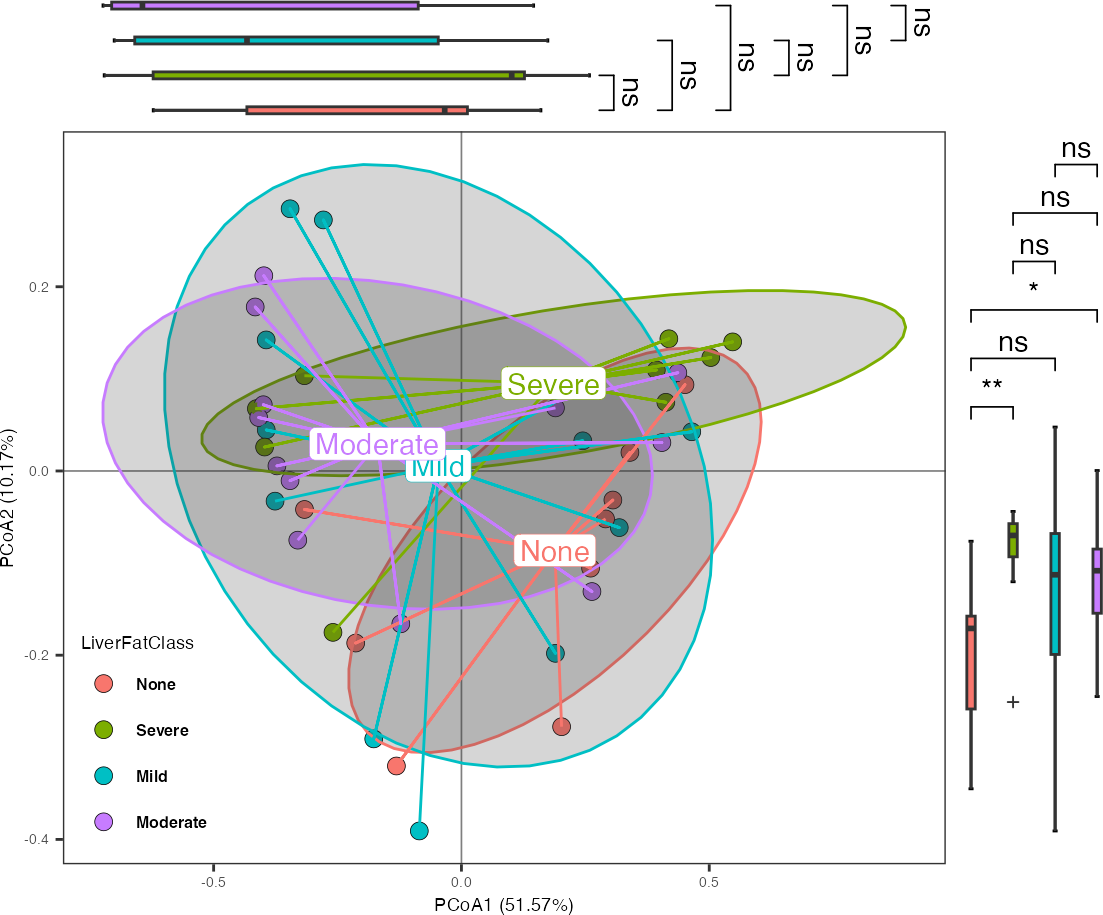
Differential analysis
Aldex
ps_genus_group <- phyloseq::subset_samples(
     ps_genus,
     body.site %in% c("gut", "tongue"))

run_aldex(ps = ps_genus_group,
          group = "body.site",
          taxa_rank = "Genus")
## microbiomeMarker-class inherited from phyloseq-class
## normalization method: [ none ]
## microbiome marker identity method: [ ALDEx2_t.test ]
## marker_table() Marker Table: [ 34 microbiome markers with 5 variables ]
## otu_table() OTU Table: [ 86 taxa and 17 samples ]
## sample_data() Sample Data: [ 17 samples by 9 sample variables ]
## tax_table() Taxonomy Table: [ 86 taxa by 1 taxonomic ranks ]limma-voom
run_limma_voom(ps = ps_genus_group,
               group = "body.site",
               taxa_rank = "Phylum")
## microbiomeMarker-class inherited from phyloseq-class
## normalization method: [ none ]
## microbiome marker identity method: [ limma_voom ]
## marker_table() Marker Table: [ 8 microbiome markers with 5 variables ]
## otu_table() OTU Table: [ 8 taxa and 17 samples ]
## sample_data() Sample Data: [ 17 samples by 9 sample variables ]
## tax_table() Taxonomy Table: [ 8 taxa by 1 taxonomic ranks ]ANCOM
data("enterotypes_arumugam")
ps_enterotypes <- phyloseq::subset_samples(
     enterotypes_arumugam,
     Enterotype %in% c("Enterotype 3", "Enterotype 2"))

run_ancom(ps = ps_enterotypes,
          group = "Enterotype")
## microbiomeMarker-class inherited from phyloseq-class
## normalization method: [ TSS ]
## microbiome marker identity method: [ ANCOM ]
## marker_table() Marker Table: [ 13 microbiome markers with 4 variables ]
## otu_table() OTU Table: [ 235 taxa and 24 samples ]
## sample_data() Sample Data: [ 24 samples by 9 sample variables ]
## tax_table() Taxonomy Table: [ 235 taxa by 1 taxonomic ranks ]ANCOMBC
run_ancombc(ps = ps_enterotypes,
            group = "Enterotype",
            confounders = "Gender")
## microbiomeMarker-class inherited from phyloseq-class
## normalization method: [ none ]
## microbiome marker identity method: [ ancombc ]
## marker_table() Marker Table: [ no microbiome markers were identified ]
## otu_table() OTU Table: [ 235 taxa and 24 samples ]
## sample_data() Sample Data: [ 24 samples by 9 sample variables ]
## tax_table() Taxonomy Table: [ 235 taxa by 1 taxonomic ranks ]DESeq2
run_deseq2(ps = ps_enterotypes,
           group = "Enterotype")
## microbiomeMarker-class inherited from phyloseq-class
## normalization method: [ RLE ]
## microbiome marker identity method: [ DESeq2: Wald ]
## marker_table() Marker Table: [ 16 microbiome markers with 5 variables ]
## otu_table() OTU Table: [ 235 taxa and 24 samples ]
## sample_data() Sample Data: [ 24 samples by 10 sample variables ]
## tax_table() Taxonomy Table: [ 235 taxa by 1 taxonomic ranks ]edgeR
run_edger(ps_enterotypes, group = "Enterotype")## microbiomeMarker-class inherited from phyloseq-class
## normalization method: [ TMM ]
## microbiome marker identity method: [ edgeR: LRT ]
## marker_table() Marker Table: [ 34 microbiome markers with 5 variables ]
## otu_table() OTU Table: [ 235 taxa and 24 samples ]
## sample_data() Sample Data: [ 24 samples by 10 sample variables ]
## tax_table() Taxonomy Table: [ 235 taxa by 1 taxonomic ranks ]lefse
run_lefse(ps = ps_enterotypes,
          group = "Enterotype")
## microbiomeMarker-class inherited from phyloseq-class
## normalization method: [ CPM ]
## microbiome marker identity method: [ lefse ]
## marker_table() Marker Table: [ 14 microbiome markers with 5 variables ]
## otu_table() OTU Table: [ 235 taxa and 24 samples ]
## sample_data() Sample Data: [ 24 samples by 9 sample variables ]
## tax_table() Taxonomy Table: [ 235 taxa by 1 taxonomic ranks ]metagenomeSeq
run_metagenomeseq(ps = ps_enterotypes,
                  group = "Enterotype")
## microbiomeMarker-class inherited from phyloseq-class
## normalization method: [ CSS ]
## microbiome marker identity method: [ metagenomeSeq: ZILN ]
## marker_table() Marker Table: [ 16 microbiome markers with 5 variables ]
## otu_table() OTU Table: [ 235 taxa and 24 samples ]
## sample_data() Sample Data: [ 24 samples by 10 sample variables ]
## tax_table() Taxonomy Table: [ 235 taxa by 1 taxonomic ranks ]test_multiple_groups
anova
kruskal
ps <- phyloseq::subset_samples(
    enterotypes_arumugam,
    Enterotype %in% c("Enterotype 3", "Enterotype 2", "Enterotype 1"))

run_test_multiple_groups(ps = ps,
                         group = "Enterotype",
                         method = "anova")
## microbiomeMarker-class inherited from phyloseq-class
## normalization method: [ TSS ]
## microbiome marker identity method: [ anova ]
## marker_table() Marker Table: [ 24 microbiome markers with 5 variables ]
## otu_table() OTU Table: [ 238 taxa and 32 samples ]
## sample_data() Sample Data: [ 32 samples by 9 sample variables ]
## tax_table() Taxonomy Table: [ 238 taxa by 1 taxonomic ranks ]supervised leaning (SL) methods
- logistic regression
ps_small <- phyloseq::subset_taxa(
    enterotypes_arumugam,
    Phylum %in% c("Firmicutes", "Bacteroidetes")
)

mm <- run_sl(
    ps = ps_small,
    group = "Gender",
    taxa_rank = "Genus",
    nfolds = 2,
    nrepeats = 1,
    top_n = 15,
    norm = "TSS",
    method = "LR")

mm
## microbiomeMarker-class inherited from phyloseq-class
## normalization method: [ TSS ]
## microbiome marker identity method: [ logistic regression ]
## marker_table() Marker Table: [ 15 microbiome markers with 3 variables ]
## otu_table() OTU Table: [ 91 taxa and 39 samples ]
## sample_data() Sample Data: [ 39 samples by 9 sample variables ]
## tax_table() Taxonomy Table: [ 91 taxa by 1 taxonomic ranks ]Differential analysis in metabolomics
-
Differential approaches:
FoldChange analysis
VIP (Variable important in projection) analysis
T-test
data("Zeybel_2022_protein")
Zeybel_2022_protein_imput <- impute_abundance(
      Zeybel_2022_protein,
      group = "LiverFatClass",
      method = "knn")
Zeybel_2022_protein_norm <- scale_variables(
      Zeybel_2022_protein_imput,
      method == "zscore")
DA_results <- run_metabolomeDA(
  object_raw = Zeybel_2022_protein,
  object_norm = Zeybel_2022_protein_norm,
  variable = "LiverFatClass",
  variable_name = c("None", "Severe"))
## PLS-DA
## 21 samples x 72 variables and 1 response
## standard scaling of predictors and response(s)
## R2X(cum) R2Y(cum) Q2(cum) RMSEE pre ort pR2Y pQ2
## Total 0.0898 0.823 0.291 0.221 1 0 0.05 0.05
head(DA_results[, 1:4], 4)## FeatureID Block2 Block FoldChange
## 1 CDCP1 None vs Severe 10_None vs 11_Severe 0.8641327
## 2 CCL20 None vs Severe 10_None vs 11_Severe 0.8715731
## 3 OPG None vs Severe 10_None vs 11_Severe 0.9720414
## 4 CCL4 None vs Severe 10_None vs 11_Severe 0.9214855- Volcano to display the significant results
plot_volcano(
   da_res = DA_results,
   group_names = c("None", "Severe"),
   x_index = "Log2FoldChange",
   x_index_cutoff = 0,
   y_index = "AdjustedPvalue",
   y_index_cutoff = 0.5,
   group_color = c("red", "grey", "blue"),
   topN = 10)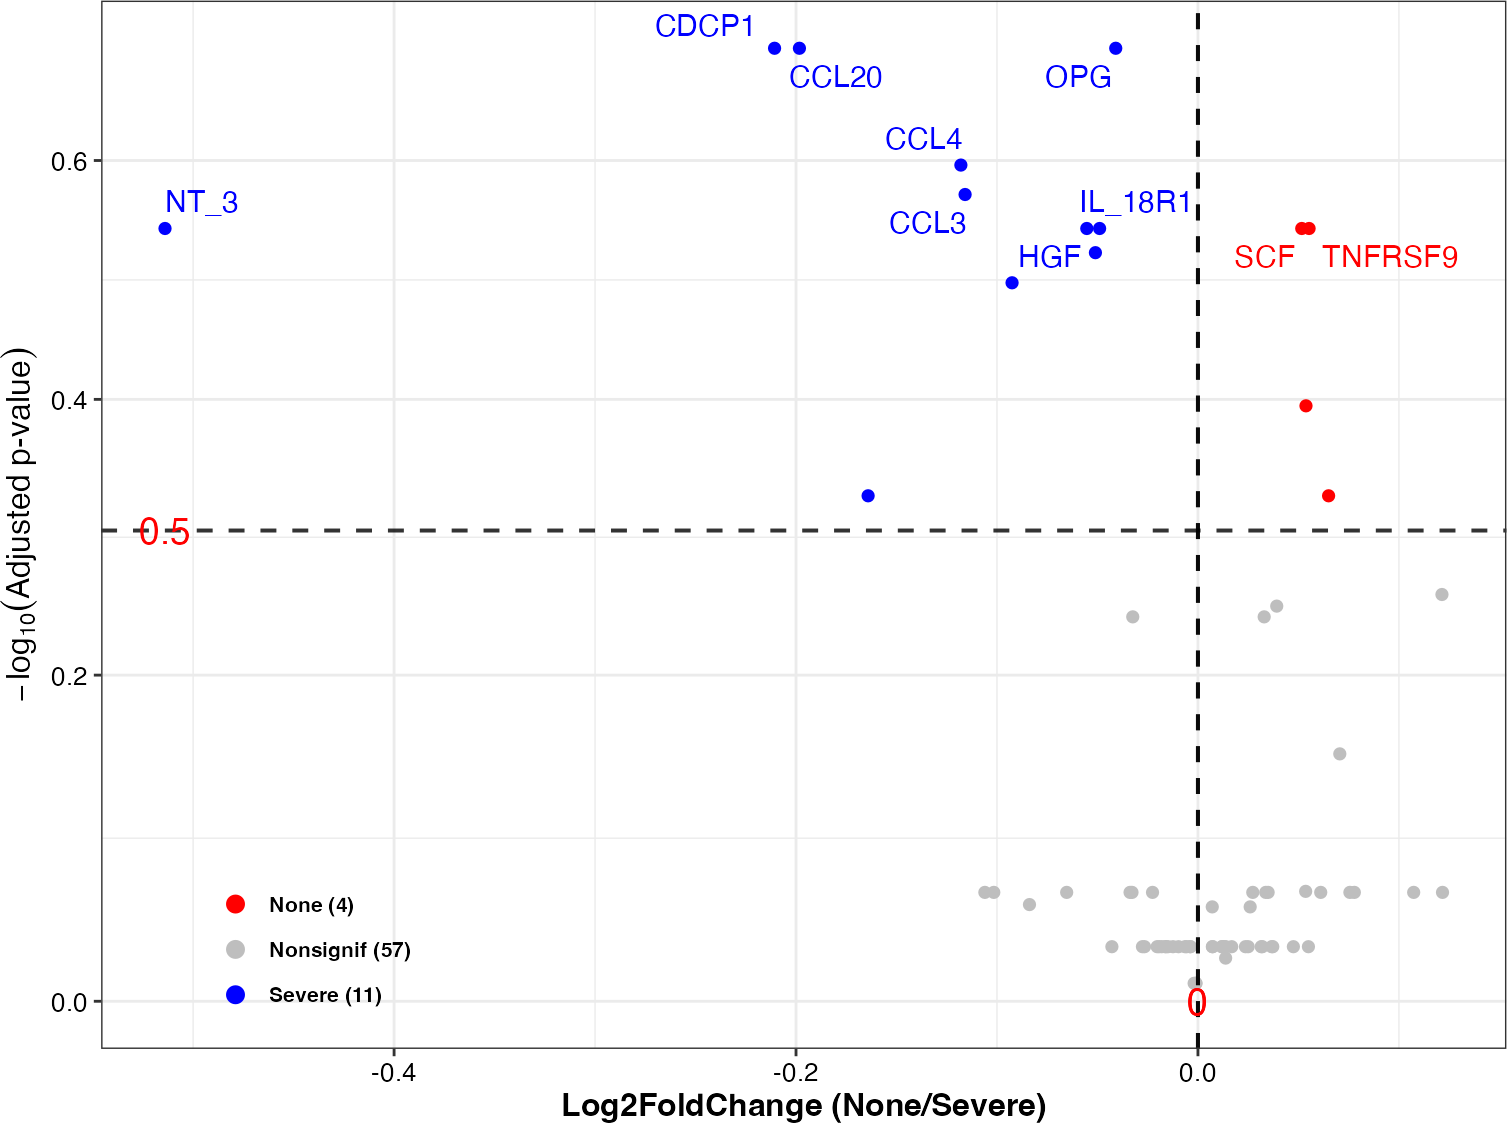
Session information
This vignette was created under the following conditions:
## R version 4.1.3 (2022-03-10)
## Platform: x86_64-apple-darwin17.0 (64-bit)
## Running under: macOS Big Sur/Monterey 10.16
##
## Matrix products: default
## BLAS:   /Library/Frameworks/R.framework/Versions/4.1/Resources/lib/libRblas.0.dylib
## LAPACK: /Library/Frameworks/R.framework/Versions/4.1/Resources/lib/libRlapack.dylib
##
## locale:
## [1] en_US.UTF-8/en_US.UTF-8/en_US.UTF-8/C/en_US.UTF-8/en_US.UTF-8
##
## attached base packages:
## [1] stats     graphics  grDevices utils     datasets  methods   base
##
## other attached packages:
## [1] caret_6.0-94             lattice_0.21-8           conflicted_1.2.0
## [4] MicrobiomeAnalysis_1.0.3 tibble_3.2.1             dplyr_1.1.2
## [7] phyloseq_1.38.0          ggplot2_3.4.2            knitr_1.43
##
## loaded via a namespace (and not attached):
##   [1] utf8_1.2.3                  tidyselect_1.2.0
##   [3] RSQLite_2.3.1               AnnotationDbi_1.60.2
##   [5] grid_4.1.3                  BiocParallel_1.28.3
##   [7] Rtsne_0.16                  pROC_1.18.4
##   [9] munsell_0.5.0               codetools_0.2-19
##  [11] ragg_1.2.5                  future_1.33.0
##  [13] withr_2.5.0                 colorspace_2.1-0
##  [15] Biobase_2.54.0              highr_0.10
##  [17] rstudioapi_0.15.0           stats4_4.1.3
##  [19] ggsignif_0.6.4              listenv_0.9.0
##  [21] MatrixGenerics_1.6.0        Rdpack_2.4
##  [23] labeling_0.4.2              GenomeInfoDbData_1.2.7
##  [25] bit64_4.0.5                 farver_2.1.1
##  [27] rhdf5_2.38.1                rprojroot_2.0.3
##  [29] parallelly_1.36.0           vctrs_0.6.3
##  [31] generics_0.1.3              ipred_0.9-14
##  [33] xfun_0.40                   timechange_0.2.0
##  [35] R6_2.5.1                    GenomeInfoDb_1.30.1
##  [37] locfit_1.5-9.8              RcppZiggurat_0.1.6
##  [39] bitops_1.0-7                rhdf5filters_1.6.0
##  [41] microbiome_1.16.0           cachem_1.0.8
##  [43] DelayedArray_0.20.0         scales_1.2.1
##  [45] nnet_7.3-19                 gtable_0.3.3
##  [47] globals_0.16.2              timeDate_4022.108
##  [49] rlang_1.1.1                 genefilter_1.76.0
##  [51] systemfonts_1.0.4           splines_4.1.3
##  [53] rstatix_0.7.2               ropls_1.26.4
##  [55] impute_1.68.0               ModelMetrics_1.2.2.2
##  [57] broom_1.0.5                 yaml_2.3.7
##  [59] reshape2_1.4.4              abind_1.4-5
##  [61] backports_1.4.1             Rfast_2.0.8
##  [63] tools_4.1.3                 lava_1.7.2.1
##  [65] zCompositions_1.4.0-1       gplots_3.1.3
##  [67] jquerylib_0.1.4             biomformat_1.22.0
##  [69] RColorBrewer_1.1-3          BiocGenerics_0.40.0
##  [71] Rcpp_1.0.11                 plyr_1.8.8
##  [73] zlibbioc_1.40.0             purrr_1.0.1
##  [75] RCurl_1.98-1.12             ggpubr_0.6.0
##  [77] rpart_4.1.19                Wrench_1.12.0
##  [79] cowplot_1.1.1               S4Vectors_0.32.4
##  [81] ggrepel_0.9.3               SummarizedExperiment_1.24.0
##  [83] cluster_2.1.4               fs_1.6.2
##  [85] magrittr_2.0.3              data.table_1.14.8
##  [87] magick_2.7.4                truncnorm_1.0-9
##  [89] matrixStats_1.0.0           ALDEx2_1.30.0
##  [91] evaluate_0.21               xtable_1.8-4
##  [93] XML_3.99-0.14               IRanges_2.28.0
##  [95] shape_1.4.6                 compiler_4.1.3
##  [97] KernSmooth_2.23-22          crayon_1.5.2
##  [99] htmltools_0.5.7             mgcv_1.8-42
## [101] tidyr_1.3.0                 geneplotter_1.72.0
## [103] ANCOMBC_1.4.0               lubridate_1.9.2
## [105] DBI_1.1.3                   MASS_7.3-60
## [107] Matrix_1.6-0                ade4_1.7-22
## [109] car_3.1-2                   permute_0.9-7
## [111] cli_3.6.1                   rbibutils_2.2.13
## [113] parallel_4.1.3              gower_1.0.1
## [115] igraph_1.5.0                GenomicRanges_1.46.1
## [117] pkgconfig_2.0.3             pkgdown_2.0.7
## [119] prettydoc_0.4.1             recipes_1.0.6
## [121] foreach_1.5.2               annotate_1.72.0
## [123] bslib_0.6.0                 hardhat_1.3.0
## [125] multtest_2.50.0             XVector_0.34.0
## [127] prodlim_2023.03.31          NADA_1.6-1.1
## [129] stringr_1.5.0               digest_0.6.33
## [131] vegan_2.6-4                 Biostrings_2.62.0
## [133] rmarkdown_2.23              edgeR_3.36.0
## [135] gtools_3.9.4                nloptr_2.0.3
## [137] lifecycle_1.0.3             nlme_3.1-162
## [139] jsonlite_1.8.7              Rhdf5lib_1.16.0
## [141] carData_3.0-5               desc_1.4.2
## [143] limma_3.50.3                fansi_1.0.4
## [145] pillar_1.9.0                KEGGREST_1.34.0
## [147] fastmap_1.1.1               httr_1.4.6
## [149] survival_3.5-5              glue_1.6.2
## [151] png_0.1-8                   iterators_1.0.14
## [153] glmnet_4.1-7                bit_4.0.5
## [155] class_7.3-22                stringi_1.7.12
## [157] sass_0.4.6                  metagenomeSeq_1.36.0
## [159] blob_1.2.4                  textshaping_0.3.6
## [161] DESeq2_1.34.0               caTools_1.18.2
## [163] memoise_2.0.1               future.apply_1.11.0
## [165] ape_5.7-1
References
Anderson, Marti J. 2014. “Permutational Multivariate Analysis of
Variance (PERMANOVA).” Wiley Statsref: Statistics Reference
Online, 1–15.
Anderson, Marti J, Kari E Ellingsen, and Brian H McArdle. 2006.
“Multivariate Dispersion as a Measure of Beta Diversity.”
Ecology Letters 9 (6): 683–93.
Clarke, K Robert. 1993. “Non-Parametric Multivariate Analyses of
Changes in Community Structure.” Australian Journal of
Ecology 18 (1): 117–43.
Mantel, Nathan. 1967. “The Detection of Disease Clustering and a
Generalized Regression Approach.” Cancer Research 27 (2
Part 1): 209–20.
Mielke Jr, Paul W. 1991. “The Application of Multivariate
Permutation Methods Based on Distance Functions in the Earth
Sciences.” Earth-Science Reviews 31 (1): 55–71.
Thingholm, Louise B, Malte C Rühlemann, Manja Koch, Brie Fuqua, Guido
Laucke, Ruwen Boehm, Corinna Bang, et al. 2019. “Obese Individuals
with and Without Type 2 Diabetes Show Different Gut Microbial Functional
Capacity and Composition.” Cell Host & Microbe 26
(2): 252–64.
Xia, Yinglin, Jun Sun, Ding-Geng Chen, et al. 2018. Statistical
Analysis of Microbiome Data with r. Vol. 847. Springer.