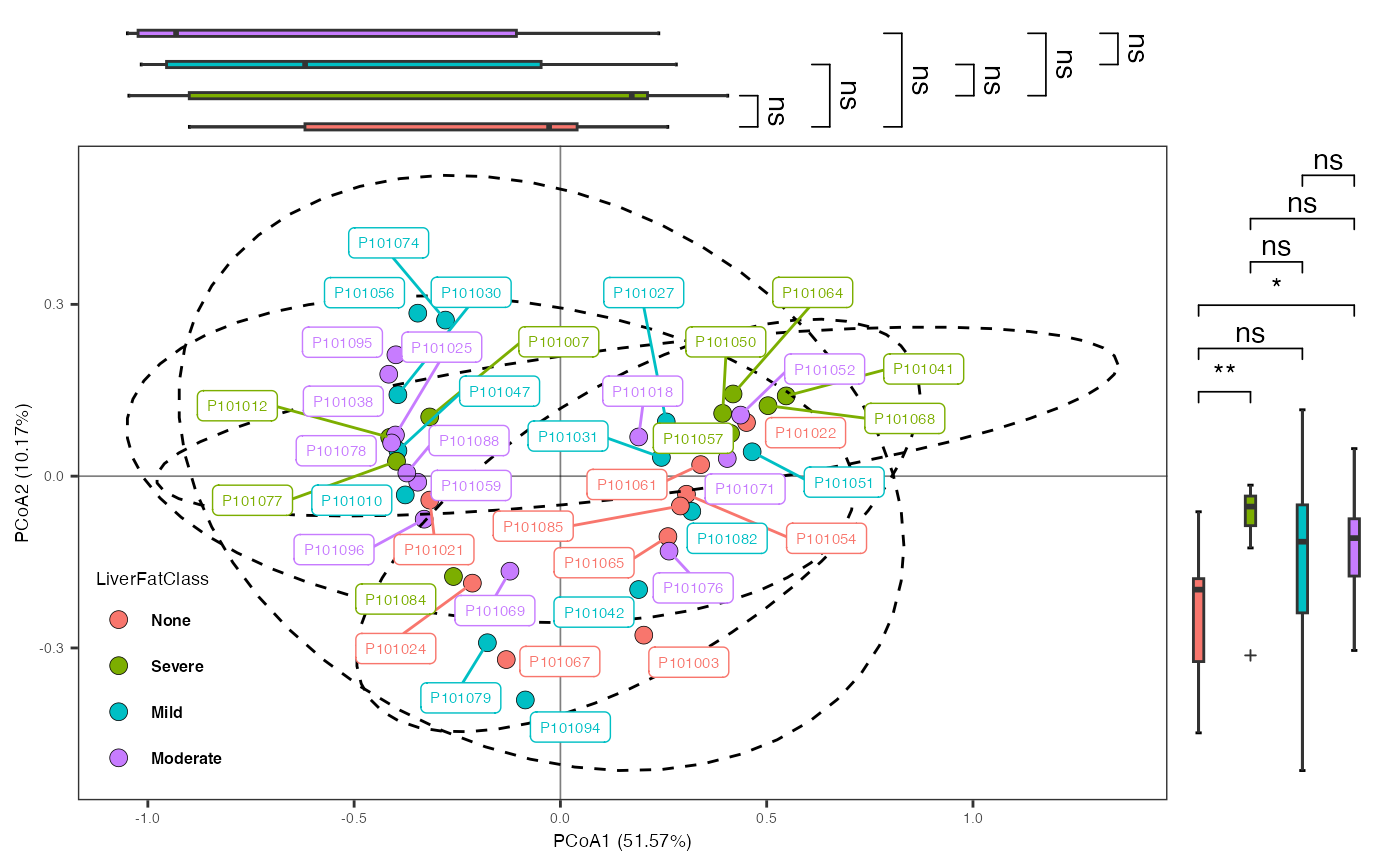
Show the result of Ordination using scatterplot.
plot_ord(
    reslist,
    variable,
    variable_name = NULL,
    variable_color = NULL,
    var_shape = NULL,
    var_shape_name = NULL,
    var_shape_value = NULL,
    display_test = FALSE,
    sample_label = FALSE,
    ellipse_type = c("none", "ellipse", "ellipse_CI" ,
                     "ellipse_groups", "ellipse_line"),
    sideboxplot = FALSE,
    point_size = 3,
    line_size = 0.3,
    ellipse_line_size = 0.5,
    geom_text_size = 5,
    theme_text_size = 8,
    theme_strip_size = 6,
    legend_position = c(0, 0),
    legend_justification = c(-0.02, -0.02),
    legend_title_size = 7,
    legend_text_size = 6,
    test_annotate_size = 4,
    geom_label_repel_size = 2,
    ...)
Arguments
- reslist
(Required). list. Results of Ordination.
- variable
(Optional). character. the variable for x-axis.
- variable_name
(Optional). character. variable' names (default: NULL).
- variable_color
(Optional). character. the color for plotting (default: NULL).
- var_shape
(Optional). character. the variable for shape' column (default: NULL).
- var_shape_name
(Optional). character. the shape' names (default: NULL).
- var_shape_value
(Optional). character. the shape values (default: NULL).
- display_test
(Optional). logical. whether to show pvalue of PERMANOVA & beta dispersion (default: FALSE).
- sample_label
(Optional). logical. whether to show sample names (default: FALSE).
- ellipse_type
(Optional). character. how to show scatter plot, including "none", "ellipse", "ellipse_CI" , "ellipse_groups" and "ellipse_line" (default: "none").
- sideboxplot
(Optional). logical. whether to show side boxplot of axis (default: FALSE).
- point_size
(Optional). numeric. point size of the scatterplot (default: 3).
- line_size
(Optional). numeric. line size (default: 0.3).
- ellipse_line_size
(Optional). numeric. ellipse line size (default: 0.5).
- geom_text_size
(Optional). numeric. geom: text size (default: 5).
- theme_text_size
(Optional). numeric. main theme: text size (default: 8).
- theme_strip_size
(Optional). numeric. main theme: strip size (default: 6).
- legend_position
(Optional). numeric. main legend: position (default: c(0, 0)).
- legend_justification
(Optional). numeric. main legend: justification (default: c(-0.02, -0.02)).
- legend_title_size
(Optional). numeric. main legend: title size (default: 7).
- legend_text_size
(Optional). numeric. main legend: text size (default: 6).
- test_annotate_size
(Optional). numeric. PERMANOVA text size (default: 4).
- geom_label_repel_size
(Optional). numeric. main geom: label repel size (default: 2).
- ...
additional parameters.
Value
A scatterplot with boxplot to show the results of ordination
Examples
# \donttest{
data("Zeybel_2022_gut")
ps_zeybel <- summarize_taxa(Zeybel_2022_gut, level = "Genus")
ord_result <- run_ord(
  object = ps_zeybel,
  variable = "LiverFatClass",
  method = "PCoA")
#> 'adonis' will be deprecated: use 'adonis2' instead

 pl <- plot_ord(
  reslist = ord_result,
  variable = "LiverFatClass",
  ellipse_type = "ellipse",
  sideboxplot = TRUE,
  sample_label = TRUE
  )
#> Warning: Ignoring unknown aesthetics: fill
#> Scale for fill is already present.
#> Adding another scale for fill, which will replace the existing scale.

 pl


# }
# }