Tutorial for R MicrobiomeAnalysis package
2023-08-16
Chapter 1 Introduction
This tutorial describes how to perform bioinformatics data analysis of microbiota using metagenomic data. It will focus on data processing, diversity analysis, biomarker identification and association investigation from microbiota expression profile which derived from amplicon (16s rRNA) or Whole genome (metagenomics) sequencing data.
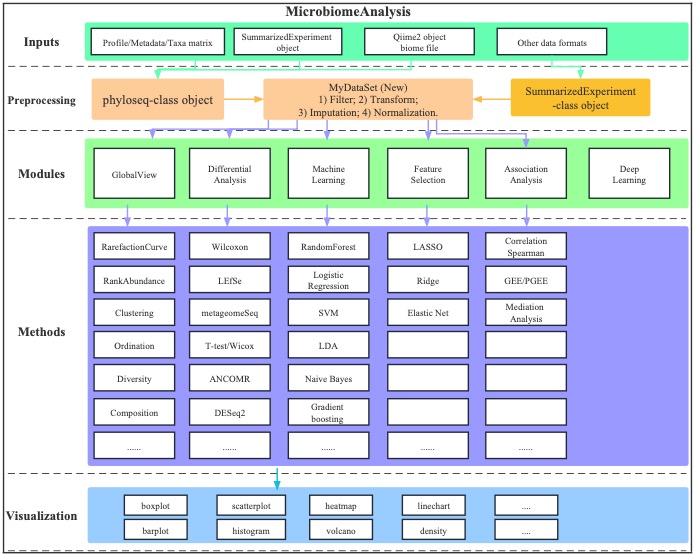
Figure 1.1: Flowchat of MicrobiomeAnalysis
The data pre-processing module includes six main procedures:
- Data Transformation
- Data Imputation
- Data Normalization
- Data Scaling
- Data Trimming
- Data Filtering
The downstream analysis includes several modules:
- Diversity analysis
- Ordination analysis
- Clustering analysis
- Differential analysis
- Association analysis
1.1 Input data
when using data pre-processing functions, it requires that the inputs which are from 16s or metagenomics data should be converted into phyloseq-class object:
Types of data. Users can handle 16s or metagenomics data coming from any platform on a transformed phyloseq-class object when they use
import_dada2orimport_qiime2.Transformation. The package provides multiple methods to transform individual values, such as log10,
Imputation. Missing value imputation methods also were provided by this package.
Normalisation.
MicrobiomeAnalysisalso has so many methods to normalize data sample by sample, which could remove technical effects.Prefiltering. Removing low abundant taxa also could be done by using
MicrobiomeAnalysis.Data format. Most functions of
MicrobiomeAnalysisare using phyloseq-class object as input. Therefore, users could convert their inputs into phyloseq-class object.
1.2 Methods
1.2.1 Some background knowledge
We list here the main methodological or theoretical concepts you need to know to be able to efficiently apply MicrobiomeAnalysis:
- phyloseq-class, SummarizedExperiment-class: the former object contains otu table, sample data and taxa table etc which are usually used in metagenomic data analysis. The latter one comprises expression data and metadata of gene, metabolites etc.
1.2.2 Key publications
phyloseq object. (McMurdie and Holmes 2013) phyloseq: an R package for reproducible interactive analysis and graphics of microbiome census data.
Permutational Multivariate Analysis of Variance (PERMANOVA). (Anderson 2014) Permutational multivariate analysis of variance (PERMANOVA).
ALDEx2. (Fernandes et al. 2014) Unifying the analysis of high-throughput sequencing datasets: characterizing RNA-seq, 16S rRNA gene sequencing and selective growth experiments by compositional data analysis.
1.4 Citation
Kindly cite by using citation(“MicrobiomeAnalysis”) if you think MicrobiomeAnalysis helps you. Alternative way is Zou H (2022). MicrobiomeAnalysis: An R package for analysis and visualization in metagenomics. R package version 1.0.3, <URL:https://github.com/HuaZou/MicrobiomeAnalysis/>.