Hua's Cabin
Hua's Cabin
Home
Posts
Experience
Publications
Contact
Bookdown
Light
Dark
Automatic
Visualization
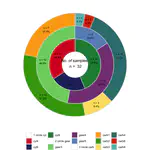
R visualization: donut chart by ggplot2
Using ggplot2 to visualize the results
Last updated on Jul 14, 2023
9 min read
Visualization
,
ggplot2
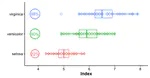
R visualization: boxplot with points labeled in percentage by ggplot2
Using ggplot2 to visualize the results
Last updated on Jun 14, 2023
5 min read
Visualization
,
ggplot2
«
Cite
×