R visualization: Distribution of longitudinal data
swimming plot
Introduction
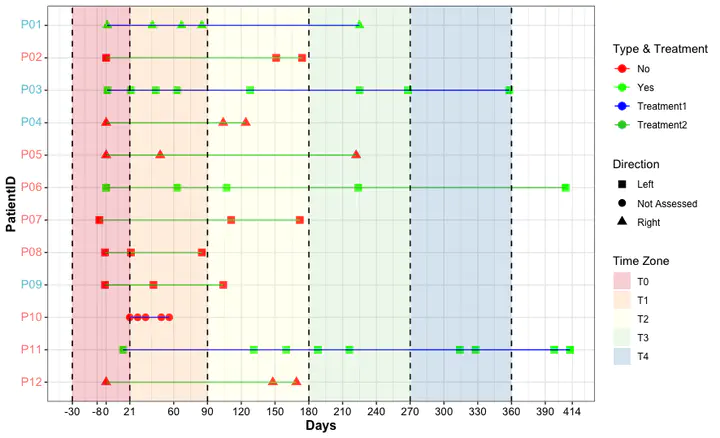
Swimming plot shows the multiple characteristics of patients.
Loading required packages
knitr::opts_chunk$set(message = FALSE, warning = FALSE)
library(tidyverse)
library(ggtext)

# rm(list = ls())
options(stringsAsFactors = F)
Data preparation
clinic_data <- read.csv(paste0(getwd(), "/patients.csv"), row.names = 1)

head(clinic_data)
##     PatientID    Group  Treatment Direction Type Day SampleID
## S_1       P01 Positive Treatment1     Right  Yes   1      S_1
## S_2       P01 Positive Treatment1     Right  Yes  67      S_2
## S_3       P01 Positive Treatment1     Right  Yes  41      S_3
## S_4       P01 Positive Treatment1     Right  Yes  85      S_4
## S_5       P01 Positive Treatment1     Right  Yes 225      S_5
## S_6       P02 Positive Treatment2      Left   No   0      S_6
Patients with clinical information have multiple samples during the therapeutic period. Here, we using swimming plot to show the distribution of sample per subject.
Plotting
Time Zone for intervals by Days
Factorizing the variables
plotdata <- clinic_data %>%
  dplyr::select(PatientID, Group, Treatment, Direction, Type, Day, SampleID) %>%
  dplyr::mutate(Day = as.numeric(Day)) %>%
  dplyr::mutate(TimeZone = case_when(
      Day > -30 & Day <= 21 ~ "T0",
      Day > 21 & Day <= 90 ~ "T1",
      Day > 91 & Day <= 180 ~ "T2",
      Day > 181 & Day <= 270 ~ "T3",
      Day > 271 ~ "T4")) %>%
  dplyr::mutate(Group = factor(Group)) %>%
  dplyr::mutate(Treatment = factor(Treatment)) %>%
  dplyr::mutate(Direction = factor(Direction)) %>%
  dplyr::mutate(Type = factor(Type)) %>%
  dplyr::mutate(TimeZone = factor(TimeZone))
plotdata$PatientID <- factor(plotdata$PatientID, levels = rev(unique(plotdata$PatientID)))

# x scale
day_range <- as.integer(range(plotdata$Day))
MinDay <- day_range[1] - 2
MaxDay <- day_range[2] + 2
breaks_seq <- c(-30,
                as.integer(rev(c(seq(0, MinDay, by=-10), MinDay))),
                21,
                as.integer(seq(60, MaxDay, by = 30)), MaxDay)

# y axis label
y_axis <- plotdata %>%
  dplyr::select(PatientID, Group) %>%
  dplyr::mutate(GroupCol = case_when(
    Group == "Positive" ~ "#F28880",
    Group == "Negative" ~ "#60C4D3"
  )) %>%
  dplyr::distinct() %>%
  dplyr::mutate(PatientID = factor(PatientID, levels = levels(plotdata$PatientID)))


# Time Zone
Time_intervals <- data.frame(
  xmin = c(-30, 21, 91, 181, 271),
  xmax = c(21, 90, 180, 270, 360),
  group = c("T0", "T1", "T2", "T3", "T4"))
- plotting
pl <- ggplot(plotdata) +
    geom_point(aes(x = as.integer(Day), y = PatientID,
                   shape = Direction, color = Type), size = 3) +
    geom_line(aes(x = as.integer(Day), y = PatientID,
                  color = Treatment)) +
    geom_vline(xintercept = c(-30, 21, 90, 180, 270, 360),
               color = "black", linewidth = 0.6, linetype = "dashed") +
    scale_shape_manual(values = c(15, 16, 17)) +
    scale_color_manual(values = c("red", "green", "blue",
                                  "#32CD32", "#9400D3", "#48D1CC",
                                  "#D51F26", "#272E6A", "#208A42", "#89288F")) +
    geom_rect(data = Time_intervals, aes(xmin = xmin, xmax = xmax,
                                         ymin = -Inf, ymax = Inf, fill = group),
              alpha = 0.2) +
    scale_fill_brewer(palette = "Spectral") +
    labs(x = "Days", y = "PatientID") +
    scale_x_continuous(breaks = breaks_seq) +
    guides(
      color = guide_legend(title = "Type & Treatment", order = 1),
      shape = guide_legend(order = 2),
      fill = guide_legend(title = "Time Zone", order = 3)) +
    theme_bw() +
    theme(axis.title = element_text(face = "bold", color = "black", size = 12),
          axis.text.x = element_text(color = "black", size = 10),
          axis.text.y = ggtext::element_markdown(size = 11, color = y_axis$GroupCol),
          legend.key.size = unit(1.2, "line"),
          legend.text = element_text(color = "black", size = 9))

pl
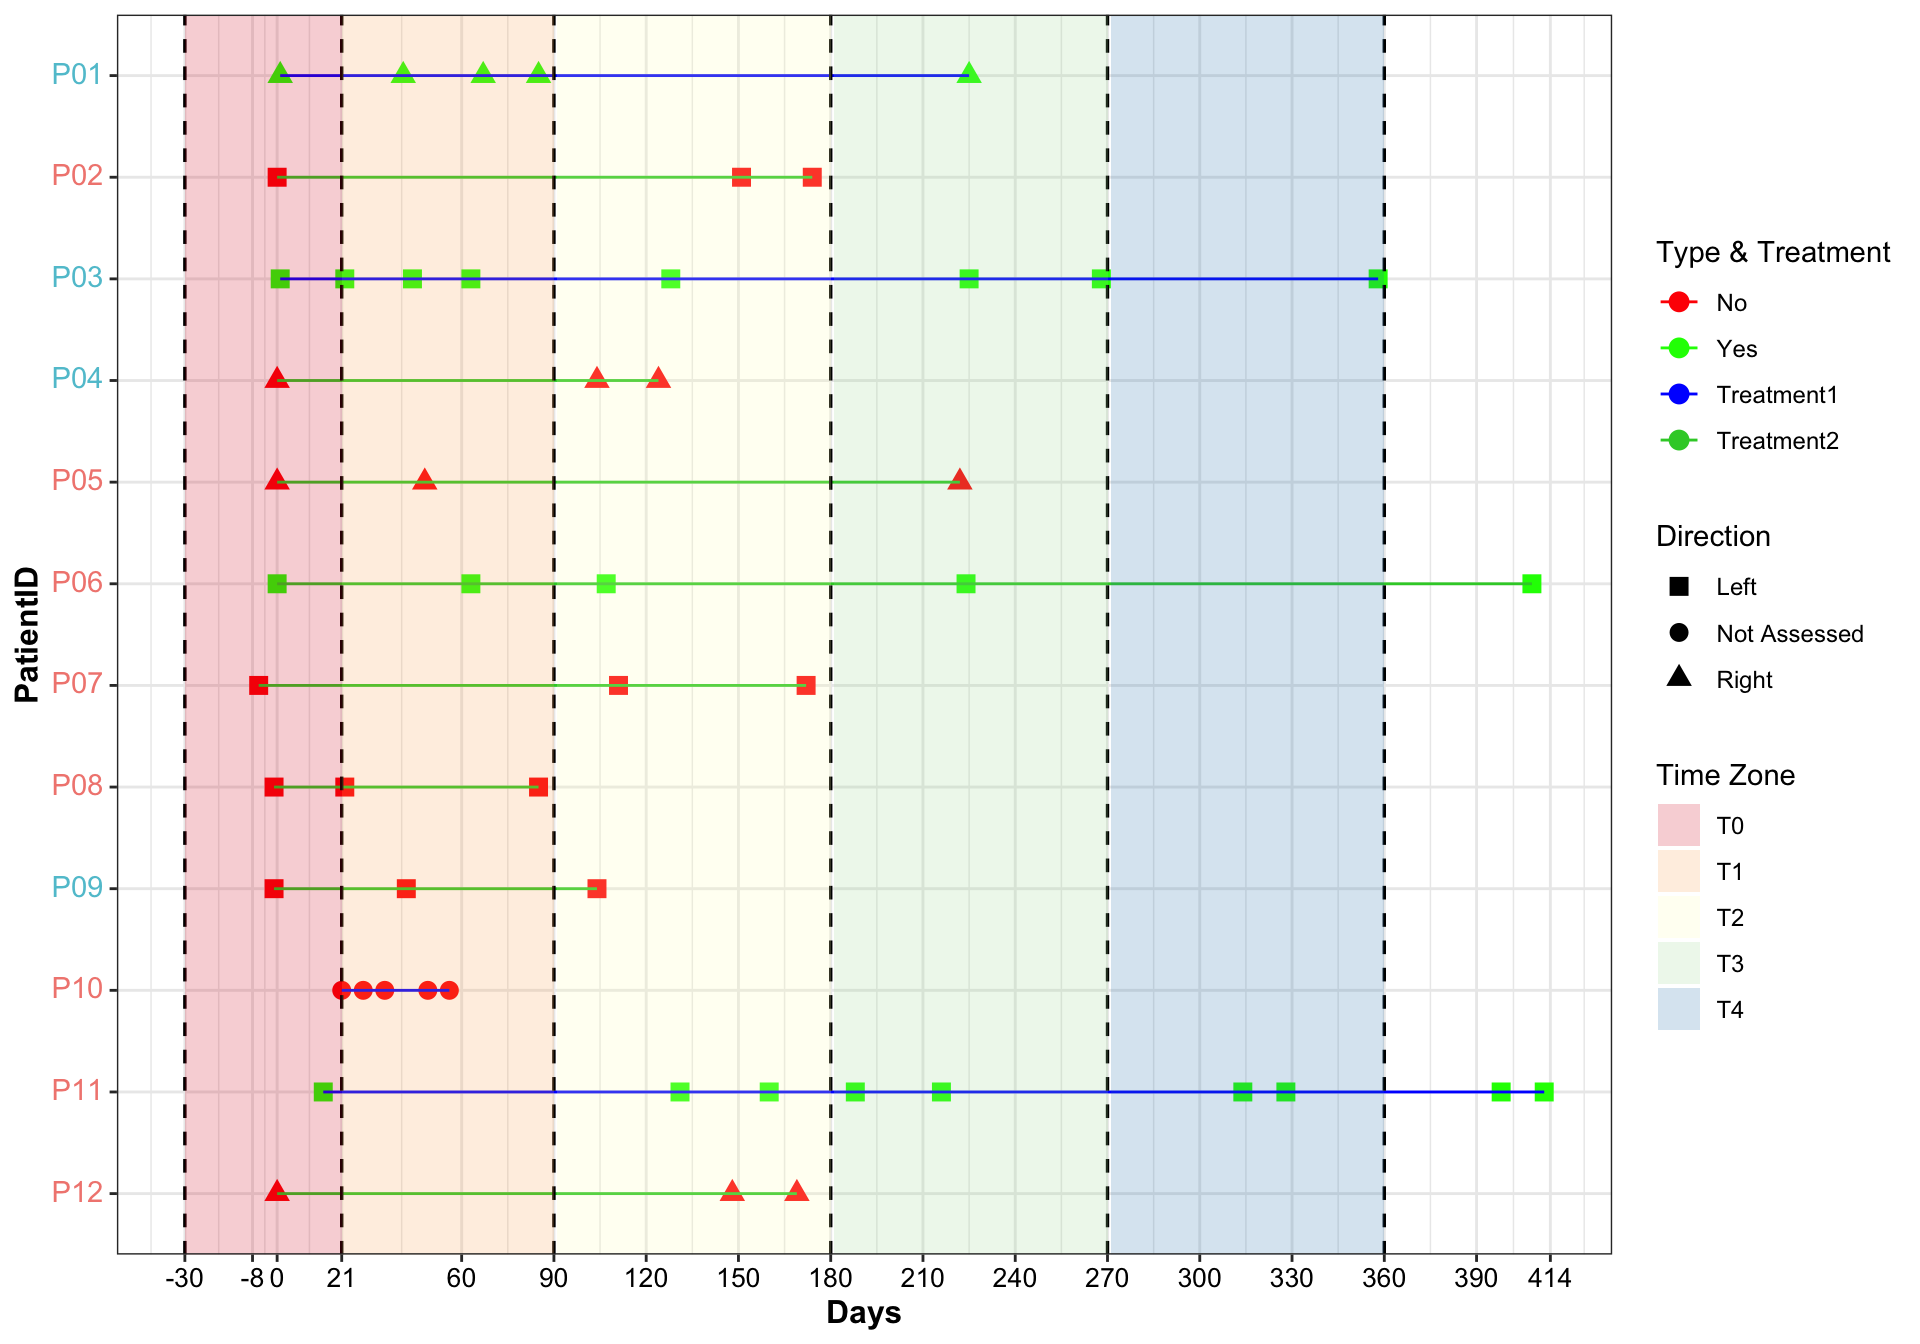
Results:
- y axis color: Group
Conclusion
Swimming plot presents lots of information from patients.
Systemic information
devtools::session_info()
## ─ Session info ───────────────────────────────────────────────────────────────
##  setting  value
##  version  R version 4.3.1 (2023-06-16)
##  os       macOS Monterey 12.2.1
##  system   x86_64, darwin20
##  ui       X11
##  language (EN)
##  collate  en_US.UTF-8
##  ctype    en_US.UTF-8
##  tz       Asia/Shanghai
##  date     2024-03-14
##  pandoc   3.1.3 @ /Users/zouhua/opt/anaconda3/bin/ (via rmarkdown)
##
## ─ Packages ───────────────────────────────────────────────────────────────────
##  package      * version date (UTC) lib source
##  blogdown       1.19    2024-02-01 [1] CRAN (R 4.3.2)
##  bookdown       0.37    2023-12-01 [1] CRAN (R 4.3.0)
##  bslib          0.6.1   2023-11-28 [1] CRAN (R 4.3.0)
##  cachem         1.0.8   2023-05-01 [1] CRAN (R 4.3.0)
##  cli            3.6.2   2023-12-11 [1] CRAN (R 4.3.0)
##  colorspace     2.1-0   2023-01-23 [1] CRAN (R 4.3.0)
##  commonmark     1.9.1   2024-01-30 [1] CRAN (R 4.3.2)
##  devtools       2.4.5   2022-10-11 [1] CRAN (R 4.3.0)
##  digest         0.6.34  2024-01-11 [1] CRAN (R 4.3.0)
##  dplyr        * 1.1.4   2023-11-17 [1] CRAN (R 4.3.0)
##  ellipsis       0.3.2   2021-04-29 [1] CRAN (R 4.3.0)
##  evaluate       0.23    2023-11-01 [1] CRAN (R 4.3.0)
##  fansi          1.0.6   2023-12-08 [1] CRAN (R 4.3.0)
##  farver         2.1.1   2022-07-06 [1] CRAN (R 4.3.0)
##  fastmap        1.1.1   2023-02-24 [1] CRAN (R 4.3.0)
##  forcats      * 1.0.0   2023-01-29 [1] CRAN (R 4.3.0)
##  fs             1.6.3   2023-07-20 [1] CRAN (R 4.3.0)
##  generics       0.1.3   2022-07-05 [1] CRAN (R 4.3.0)
##  ggplot2      * 3.4.4   2023-10-12 [1] CRAN (R 4.3.0)
##  ggtext       * 0.1.2   2022-09-16 [1] CRAN (R 4.3.0)
##  glue           1.7.0   2024-01-09 [1] CRAN (R 4.3.0)
##  gridtext       0.1.5   2022-09-16 [1] CRAN (R 4.3.0)
##  gtable         0.3.4   2023-08-21 [1] CRAN (R 4.3.0)
##  highr          0.10    2022-12-22 [1] CRAN (R 4.3.0)
##  hms            1.1.3   2023-03-21 [1] CRAN (R 4.3.0)
##  htmltools      0.5.7   2023-11-03 [1] CRAN (R 4.3.0)
##  htmlwidgets    1.6.4   2023-12-06 [1] CRAN (R 4.3.0)
##  httpuv         1.6.14  2024-01-26 [1] CRAN (R 4.3.2)
##  jquerylib      0.1.4   2021-04-26 [1] CRAN (R 4.3.0)
##  jsonlite       1.8.8   2023-12-04 [1] CRAN (R 4.3.0)
##  knitr          1.45    2023-10-30 [1] CRAN (R 4.3.0)
##  later          1.3.2   2023-12-06 [1] CRAN (R 4.3.0)
##  lifecycle      1.0.4   2023-11-07 [1] CRAN (R 4.3.0)
##  lubridate    * 1.9.3   2023-09-27 [1] CRAN (R 4.3.0)
##  magrittr       2.0.3   2022-03-30 [1] CRAN (R 4.3.0)
##  markdown       1.12    2023-12-06 [1] CRAN (R 4.3.0)
##  memoise        2.0.1   2021-11-26 [1] CRAN (R 4.3.0)
##  mime           0.12    2021-09-28 [1] CRAN (R 4.3.0)
##  miniUI         0.1.1.1 2018-05-18 [1] CRAN (R 4.3.0)
##  munsell        0.5.0   2018-06-12 [1] CRAN (R 4.3.0)
##  pillar         1.9.0   2023-03-22 [1] CRAN (R 4.3.0)
##  pkgbuild       1.4.3   2023-12-10 [1] CRAN (R 4.3.0)
##  pkgconfig      2.0.3   2019-09-22 [1] CRAN (R 4.3.0)
##  pkgload        1.3.4   2024-01-16 [1] CRAN (R 4.3.0)
##  profvis        0.3.8   2023-05-02 [1] CRAN (R 4.3.0)
##  promises       1.2.1   2023-08-10 [1] CRAN (R 4.3.0)
##  purrr        * 1.0.2   2023-08-10 [1] CRAN (R 4.3.0)
##  R6             2.5.1   2021-08-19 [1] CRAN (R 4.3.0)
##  RColorBrewer   1.1-3   2022-04-03 [1] CRAN (R 4.3.0)
##  Rcpp           1.0.12  2024-01-09 [1] CRAN (R 4.3.0)
##  readr        * 2.1.5   2024-01-10 [1] CRAN (R 4.3.0)
##  remotes        2.4.2.1 2023-07-18 [1] CRAN (R 4.3.0)
##  rlang          1.1.3   2024-01-10 [1] CRAN (R 4.3.0)
##  rmarkdown      2.25    2023-09-18 [1] CRAN (R 4.3.0)
##  rstudioapi     0.15.0  2023-07-07 [1] CRAN (R 4.3.0)
##  sass           0.4.8   2023-12-06 [1] CRAN (R 4.3.0)
##  scales         1.3.0   2023-11-28 [1] CRAN (R 4.3.0)
##  sessioninfo    1.2.2   2021-12-06 [1] CRAN (R 4.3.0)
##  shiny          1.8.0   2023-11-17 [1] CRAN (R 4.3.0)
##  stringi        1.8.3   2023-12-11 [1] CRAN (R 4.3.0)
##  stringr      * 1.5.1   2023-11-14 [1] CRAN (R 4.3.0)
##  tibble       * 3.2.1   2023-03-20 [1] CRAN (R 4.3.0)
##  tidyr        * 1.3.1   2024-01-24 [1] CRAN (R 4.3.2)
##  tidyselect     1.2.0   2022-10-10 [1] CRAN (R 4.3.0)
##  tidyverse    * 2.0.0   2023-02-22 [1] CRAN (R 4.3.0)
##  timechange     0.3.0   2024-01-18 [1] CRAN (R 4.3.0)
##  tzdb           0.4.0   2023-05-12 [1] CRAN (R 4.3.0)
##  urlchecker     1.0.1   2021-11-30 [1] CRAN (R 4.3.0)
##  usethis        2.2.2   2023-07-06 [1] CRAN (R 4.3.0)
##  utf8           1.2.4   2023-10-22 [1] CRAN (R 4.3.0)
##  vctrs          0.6.5   2023-12-01 [1] CRAN (R 4.3.0)
##  withr          3.0.0   2024-01-16 [1] CRAN (R 4.3.0)
##  xfun           0.41    2023-11-01 [1] CRAN (R 4.3.0)
##  xml2           1.3.6   2023-12-04 [1] CRAN (R 4.3.0)
##  xtable         1.8-4   2019-04-21 [1] CRAN (R 4.3.0)
##  yaml           2.3.8   2023-12-11 [1] CRAN (R 4.3.0)
##
##  [1] /Library/Frameworks/R.framework/Versions/4.3-x86_64/Resources/library
##
## ──────────────────────────────────────────────────────────────────────────────
Hua Zou
Senior Bioinformatic Analyst
My research interests include host-microbiota intersection, machine learning and multi-omics data integration.