R visualization: Raincloud plot by ggplot2
Raincloud plot
Introduction
Raincloud plot can be used to visualize raw data, the distribution of the data, and the key summary statistics at the same time.
Loading required packages
knitr::opts_chunk$set(message = FALSE, warning = FALSE)
library(ggpubr)
library(ggdist)
library(gghalves)
library(tidyverse)

# rm(list = ls())
options(stringsAsFactors = F)

# group & color
sp_names <- c("setosa", "versicolor", "virginica")
sp_colors <- c("#0073C2FF", "#EFC000FF", "#CD534CFF")
Data preparation
- Data object iris
data("iris")

data_pre <- iris

head(data_pre)
##   Sepal.Length Sepal.Width Petal.Length Petal.Width Species
## 1          5.1         3.5          1.4         0.2  setosa
## 2          4.9         3.0          1.4         0.2  setosa
## 3          4.7         3.2          1.3         0.2  setosa
## 4          4.6         3.1          1.5         0.2  setosa
## 5          5.0         3.6          1.4         0.2  setosa
## 6          5.4         3.9          1.7         0.4  setosa
Plot function
get_raincloud <- function(
    dat,
    group,
    group_names,
    group_colors,
    measures) {

  # group for plot x-label
  dat_cln2 <- dat
  colnames(dat_cln2)[which(colnames(dat_cln2) == group)] <- "Group_new"

  if (group_names[1] == "all") {
    tempdata <- dat_cln2
  } else {
    tempdata <- dat_cln2 %>%
      dplyr::filter(Group_new %in% group_names)
  }
  tempdata$Group_new <- factor(tempdata$Group_new, levels = group_names)

  if (length(measures) > 1) {
    plotdata <- tempdata %>%
      dplyr::select(all_of(c("Group_new", measures))) %>%
      tidyr::pivot_longer(cols = 2:(length(measures)+1),
                          names_to = "Index",
                          values_to = "Values") %>%
      dplyr::mutate(Index = factor(Index, levels = measures))
  } else {
    plotdata <- tempdata %>%
      dplyr::select(all_of(c("Group_new", measures)))
    colnames(plotdata)[2] <- "Values"
  }

  cmp <- list()
  num <- utils::combn(length(group_names), 2)
  for (i in 1:ncol(num)) {
    cmp[[i]] <- num[, i]
  }

  if (length(measures) > 1) {
    pl <- ggplot(plotdata, aes(x = Group_new, y = Values, fill = Group_new)) +
      ggdist::stat_halfeye(adjust = 0.5, width = 0.3,
                           .width = 0, justification = -0.3, point_colour = NA) +
      stat_boxplot(aes(color = Group_new), geom = "errorbar", width = 0.1) +
      geom_boxplot(width = 0.1, outlier.shape = NA) +
      gghalves::geom_half_point(side = "l", range_scale = 0.4, alpha = 0.5) +
      stat_summary(geom = "crossbar", width = 0.08, fatten = 0, color = "white",
               fun.data = function(x){c(y = median(x), ymin = median(x), ymax = median(x))}) +
      labs(x = "", y = "Value") +
      scale_fill_manual(values = group_colors) +
      scale_color_manual(values = group_colors) +
      guides(fill = "none", color = "none") +
      scale_y_continuous(expand = expansion(mult = c(0.1, 0.1))) +
      ggpubr::stat_compare_means(method = "wilcox.test",
                                 comparisons = cmp) +
      facet_wrap(.~ Index, scales = "free") +
      theme_bw() +
      theme(axis.title.y = element_text(size = 10, face = "bold"),
            axis.text.y = element_text(size = 9),
            axis.text.x = element_text(size = 10, hjust = .5, vjust = .5, angle = 30),
            strip.text = element_text(size = 12, face = "bold", color = "black"))
  } else {
    pl <- ggplot(plotdata, aes(x = Group_new, y = Values, fill = Group_new)) +
      ggdist::stat_halfeye(adjust = 0.5, width = 0.3,
                           .width = 0, justification = -0.3, point_colour = NA) +
      stat_boxplot(aes(color = Group_new), geom = "errorbar", width = 0.1) +
      geom_boxplot(width = 0.1, outlier.shape = NA) +
      gghalves::geom_half_point(side = "l", range_scale = 0.4, alpha = 0.5) +
      stat_summary(geom = "crossbar", width = 0.08, fatten = 0, color = "white",
               fun.data = function(x){c(y = median(x), ymin = median(x), ymax = median(x))}) +
      labs(x = "", y = measures) +
      scale_fill_manual(values = group_colors) +
      scale_color_manual(values = group_colors) +
      guides(fill = "none", color = "none") +
      scale_y_continuous(expand = expansion(mult = c(0.1, 0.1))) +
      ggpubr::stat_compare_means(method = "wilcox.test",
                                 comparisons = cmp) +
      theme_bw() +
      theme(axis.title.y = element_text(size = 10, face = "bold"),
            axis.text.y = element_text(size = 9),
            axis.text.x = element_text(size = 10, hjust = .5, vjust = .5, angle = 30),
            strip.text = element_text(size = 12, face = "bold", color = "black"))
  }

  return(pl)
}
Raincloud plot with single measure
get_raincloud(
  dat = data_pre,
  group = "Species",
  group_names = sp_names,
  group_colors = sp_colors,
  measures = "Sepal.Length")
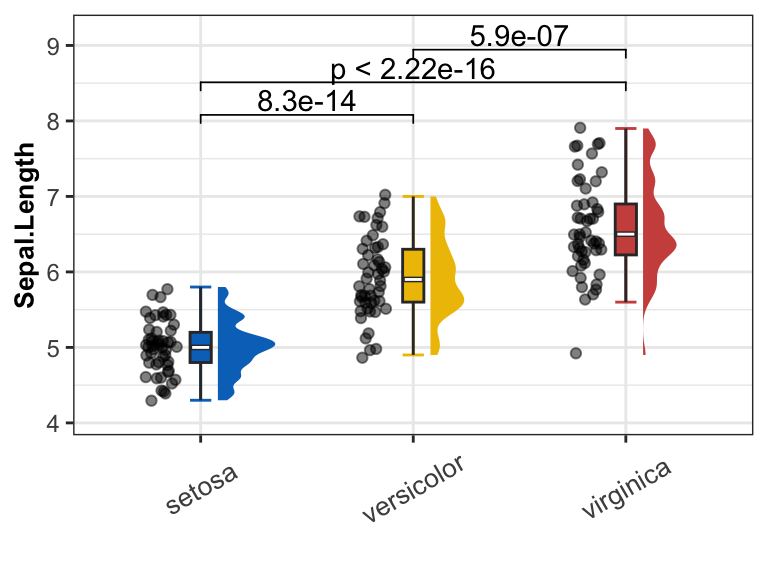
Results:
- Raincloud plot shows the distribution of the data and the boxplot of data in three groups.
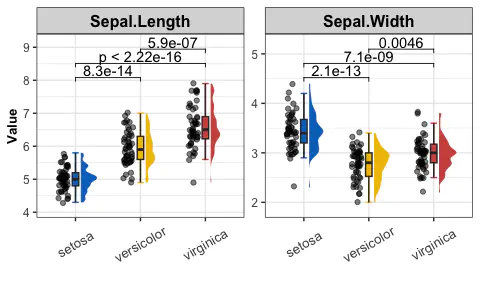
Raincloud plot with mulitple measures
get_raincloud(
  dat = data_pre,
  group = "Species",
  group_names = sp_names,
  group_colors = sp_colors,
  measures = c("Sepal.Length", "Sepal.Width"))
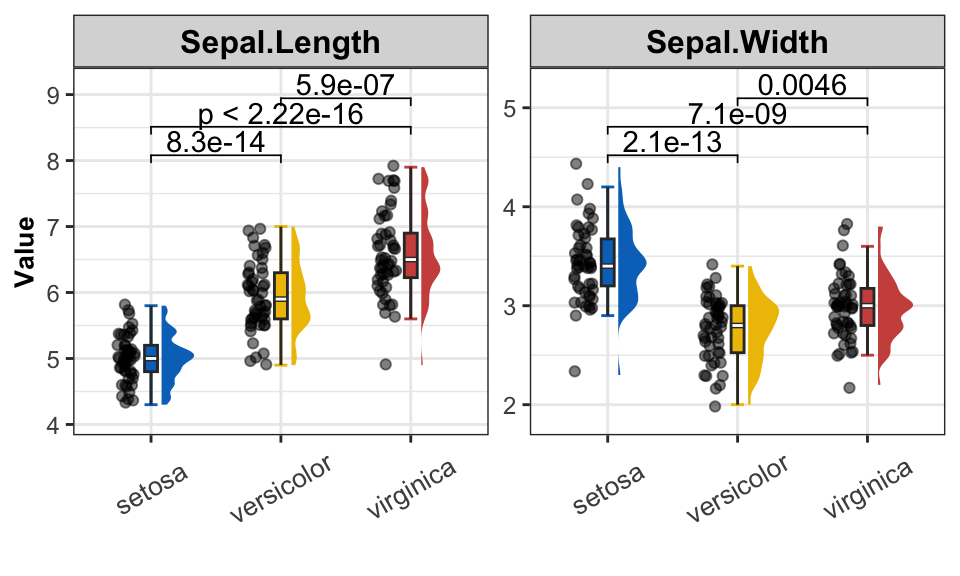
Conclusion
RainCloud plots using Half Violin plot with jittered data points to show the distribution of the data.
Systemic information
devtools::session_info()
## ─ Session info ───────────────────────────────────────────────────────────────
##  setting  value
##  version  R version 4.3.1 (2023-06-16)
##  os       macOS Monterey 12.2.1
##  system   x86_64, darwin20
##  ui       X11
##  language (EN)
##  collate  en_US.UTF-8
##  ctype    en_US.UTF-8
##  tz       Asia/Shanghai
##  date     2024-03-14
##  pandoc   3.1.3 @ /Users/zouhua/opt/anaconda3/bin/ (via rmarkdown)
##
## ─ Packages ───────────────────────────────────────────────────────────────────
##  package        * version date (UTC) lib source
##  abind            1.4-5   2016-07-21 [1] CRAN (R 4.3.0)
##  backports        1.4.1   2021-12-13 [1] CRAN (R 4.3.0)
##  blogdown         1.19    2024-02-01 [1] CRAN (R 4.3.2)
##  bookdown         0.37    2023-12-01 [1] CRAN (R 4.3.0)
##  broom            1.0.5   2023-06-09 [1] CRAN (R 4.3.0)
##  bslib            0.6.1   2023-11-28 [1] CRAN (R 4.3.0)
##  cachem           1.0.8   2023-05-01 [1] CRAN (R 4.3.0)
##  car              3.1-2   2023-03-30 [1] CRAN (R 4.3.0)
##  carData          3.0-5   2022-01-06 [1] CRAN (R 4.3.0)
##  cli              3.6.2   2023-12-11 [1] CRAN (R 4.3.0)
##  colorspace       2.1-0   2023-01-23 [1] CRAN (R 4.3.0)
##  devtools         2.4.5   2022-10-11 [1] CRAN (R 4.3.0)
##  digest           0.6.34  2024-01-11 [1] CRAN (R 4.3.0)
##  distributional   0.3.2   2023-03-22 [1] CRAN (R 4.3.0)
##  dplyr          * 1.1.4   2023-11-17 [1] CRAN (R 4.3.0)
##  ellipsis         0.3.2   2021-04-29 [1] CRAN (R 4.3.0)
##  evaluate         0.23    2023-11-01 [1] CRAN (R 4.3.0)
##  fansi            1.0.6   2023-12-08 [1] CRAN (R 4.3.0)
##  farver           2.1.1   2022-07-06 [1] CRAN (R 4.3.0)
##  fastmap          1.1.1   2023-02-24 [1] CRAN (R 4.3.0)
##  forcats        * 1.0.0   2023-01-29 [1] CRAN (R 4.3.0)
##  fs               1.6.3   2023-07-20 [1] CRAN (R 4.3.0)
##  generics         0.1.3   2022-07-05 [1] CRAN (R 4.3.0)
##  ggdist         * 3.3.1   2023-11-27 [1] CRAN (R 4.3.0)
##  gghalves       * 0.1.4   2022-11-20 [1] CRAN (R 4.3.0)
##  ggplot2        * 3.4.4   2023-10-12 [1] CRAN (R 4.3.0)
##  ggpubr         * 0.6.0   2023-02-10 [1] CRAN (R 4.3.0)
##  ggsignif         0.6.4   2022-10-13 [1] CRAN (R 4.3.0)
##  glue             1.7.0   2024-01-09 [1] CRAN (R 4.3.0)
##  gtable           0.3.4   2023-08-21 [1] CRAN (R 4.3.0)
##  highr            0.10    2022-12-22 [1] CRAN (R 4.3.0)
##  hms              1.1.3   2023-03-21 [1] CRAN (R 4.3.0)
##  htmltools        0.5.7   2023-11-03 [1] CRAN (R 4.3.0)
##  htmlwidgets      1.6.4   2023-12-06 [1] CRAN (R 4.3.0)
##  httpuv           1.6.14  2024-01-26 [1] CRAN (R 4.3.2)
##  jquerylib        0.1.4   2021-04-26 [1] CRAN (R 4.3.0)
##  jsonlite         1.8.8   2023-12-04 [1] CRAN (R 4.3.0)
##  knitr            1.45    2023-10-30 [1] CRAN (R 4.3.0)
##  labeling         0.4.3   2023-08-29 [1] CRAN (R 4.3.0)
##  later            1.3.2   2023-12-06 [1] CRAN (R 4.3.0)
##  lifecycle        1.0.4   2023-11-07 [1] CRAN (R 4.3.0)
##  lubridate      * 1.9.3   2023-09-27 [1] CRAN (R 4.3.0)
##  magrittr         2.0.3   2022-03-30 [1] CRAN (R 4.3.0)
##  memoise          2.0.1   2021-11-26 [1] CRAN (R 4.3.0)
##  mime             0.12    2021-09-28 [1] CRAN (R 4.3.0)
##  miniUI           0.1.1.1 2018-05-18 [1] CRAN (R 4.3.0)
##  munsell          0.5.0   2018-06-12 [1] CRAN (R 4.3.0)
##  pillar           1.9.0   2023-03-22 [1] CRAN (R 4.3.0)
##  pkgbuild         1.4.3   2023-12-10 [1] CRAN (R 4.3.0)
##  pkgconfig        2.0.3   2019-09-22 [1] CRAN (R 4.3.0)
##  pkgload          1.3.4   2024-01-16 [1] CRAN (R 4.3.0)
##  profvis          0.3.8   2023-05-02 [1] CRAN (R 4.3.0)
##  promises         1.2.1   2023-08-10 [1] CRAN (R 4.3.0)
##  purrr          * 1.0.2   2023-08-10 [1] CRAN (R 4.3.0)
##  R6               2.5.1   2021-08-19 [1] CRAN (R 4.3.0)
##  Rcpp             1.0.12  2024-01-09 [1] CRAN (R 4.3.0)
##  readr          * 2.1.5   2024-01-10 [1] CRAN (R 4.3.0)
##  remotes          2.4.2.1 2023-07-18 [1] CRAN (R 4.3.0)
##  rlang            1.1.3   2024-01-10 [1] CRAN (R 4.3.0)
##  rmarkdown        2.25    2023-09-18 [1] CRAN (R 4.3.0)
##  rstatix          0.7.2   2023-02-01 [1] CRAN (R 4.3.0)
##  rstudioapi       0.15.0  2023-07-07 [1] CRAN (R 4.3.0)
##  sass             0.4.8   2023-12-06 [1] CRAN (R 4.3.0)
##  scales           1.3.0   2023-11-28 [1] CRAN (R 4.3.0)
##  sessioninfo      1.2.2   2021-12-06 [1] CRAN (R 4.3.0)
##  shiny            1.8.0   2023-11-17 [1] CRAN (R 4.3.0)
##  stringi          1.8.3   2023-12-11 [1] CRAN (R 4.3.0)
##  stringr        * 1.5.1   2023-11-14 [1] CRAN (R 4.3.0)
##  tibble         * 3.2.1   2023-03-20 [1] CRAN (R 4.3.0)
##  tidyr          * 1.3.1   2024-01-24 [1] CRAN (R 4.3.2)
##  tidyselect       1.2.0   2022-10-10 [1] CRAN (R 4.3.0)
##  tidyverse      * 2.0.0   2023-02-22 [1] CRAN (R 4.3.0)
##  timechange       0.3.0   2024-01-18 [1] CRAN (R 4.3.0)
##  tzdb             0.4.0   2023-05-12 [1] CRAN (R 4.3.0)
##  urlchecker       1.0.1   2021-11-30 [1] CRAN (R 4.3.0)
##  usethis          2.2.2   2023-07-06 [1] CRAN (R 4.3.0)
##  utf8             1.2.4   2023-10-22 [1] CRAN (R 4.3.0)
##  vctrs            0.6.5   2023-12-01 [1] CRAN (R 4.3.0)
##  withr            3.0.0   2024-01-16 [1] CRAN (R 4.3.0)
##  xfun             0.41    2023-11-01 [1] CRAN (R 4.3.0)
##  xtable           1.8-4   2019-04-21 [1] CRAN (R 4.3.0)
##  yaml             2.3.8   2023-12-11 [1] CRAN (R 4.3.0)
##
##  [1] /Library/Frameworks/R.framework/Versions/4.3-x86_64/Resources/library
##
## ──────────────────────────────────────────────────────────────────────────────
Hua Zou
Senior Bioinformatic Analyst
My research interests include host-microbiota intersection, machine learning and multi-omics data integration.