R visualization: boxplot with outlier by ggplot2
boxplot with outlier
Introduction
Boxplot with outliers’ name and groups’ number gives more information to observe the differences among groups.
Loading required packages
knitr::opts_chunk$set(message = FALSE, warning = FALSE)

library(tidyverse)
library(ggpubr)

rm(list = ls())
options(stringsAsFactors = F)

# group & color
group_names <- c("setosa", "versicolor", "virginica")
group_colors <- c("#0073C2FF", "#EFC000FF", "#CD534CFF")
Data preparation
Loading iris dataset
Factorizing Species
Randomly choosing outliers
data("iris")

plotdata <- iris |>
  dplyr::select(Sepal.Length, Species) |>
  dplyr::mutate(Species = factor(Species, levels = group_names)) |>
  dplyr::rename(Group = Species,
                Index = Sepal.Length) |>
  dplyr::mutate(SampleID = paste0("S_", 1:nrow(iris))) |>
  dplyr::select(SampleID, Group, Index)

# outlier: range(plotdata$Index)

plotdata$Index[sample(150, 3)] <- c(9, 10, 11)

head(plotdata)
##   SampleID  Group Index
## 1      S_1 setosa   5.1
## 2      S_2 setosa   4.9
## 3      S_3 setosa   4.7
## 4      S_4 setosa   4.6
## 5      S_5 setosa   5.0
## 6      S_6 setosa   5.4
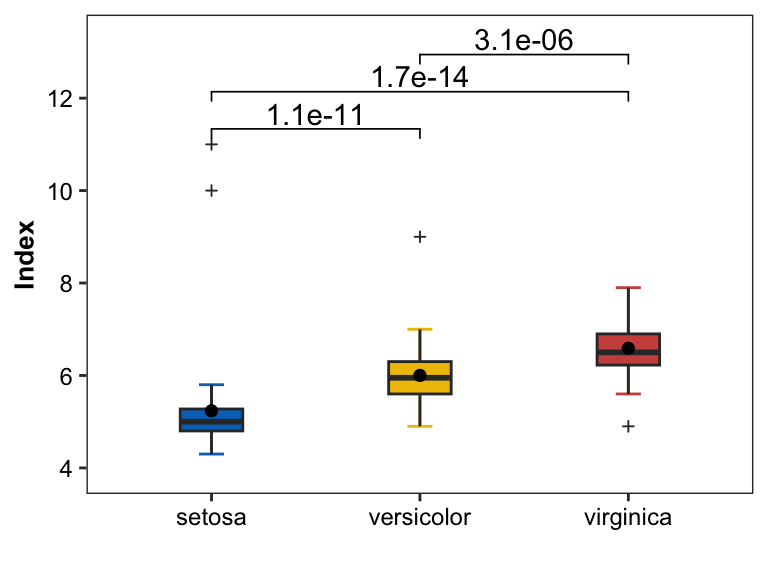
Simple Boxplot
construct groups for comparison
create boxplot by
stat_boxplotandgeom_boxplotadd mean point by
stat_summary
cmp <- NULL
for (i in 1:(length(group_names) -1 )) {
  for (j in (i+1):length(group_names)) {
    tmp <- c(group_names[i], group_names[j])
    if (is.null(cmp)) {
      cmp[[1]] <- tmp
    } else {
      cmp[[i+1]] <- tmp
    }
  }
}

pl0 <- ggplot(plotdata, aes(x = Group, y = Index, fill = Group)) +
  stat_boxplot(aes(color = Group), geom = "errorbar", width = .12) +
  geom_boxplot(width = .3, outlier.shape = 3, outlier.size = 1) +
  stat_summary(fun = mean, geom = "point", shape = 16,
               size = 2, color = "black") +
  guides(fill = "none", color = "none") +
  stat_compare_means(comparisons = cmp,
                     method = "wilcox.test",
                     label = "p.label") +
  labs(x = "") +
  theme_bw() +
  scale_fill_manual(values = group_colors) +
  scale_color_manual(values = group_colors)+
  scale_y_continuous(expand = expansion(mult = c(0.1, 0.1))) +
  theme(plot.title = element_text(size = 10, color = "black", face = "bold", hjust = 0.5),
        axis.title = element_text(size = 10, color = "black", face = "bold"),
        axis.text = element_text(size = 9, color = "black"),
        text = element_text(size = 8, color = "black"),
        strip.text = element_text(size = 9, color = "black", face = "bold"),
        panel.grid = element_blank())

pl0
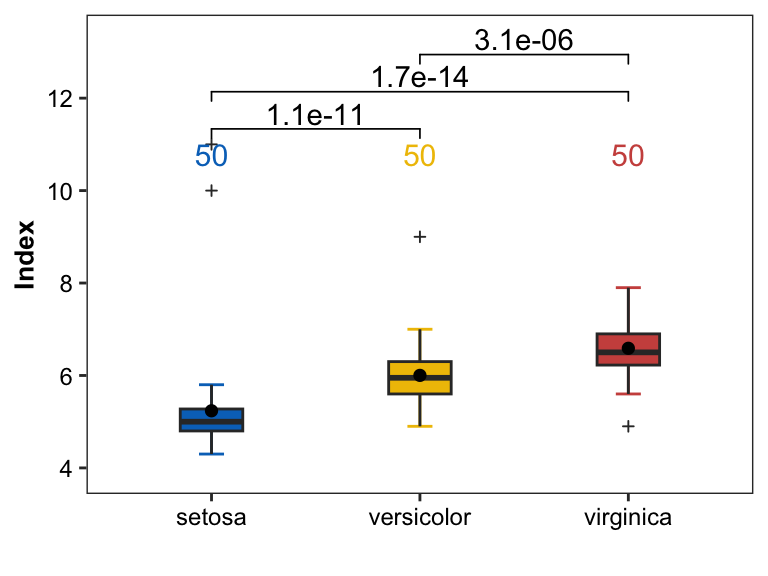
Boxplot with groups’ number
- add groups’ number in the corresponding position by
stat_summary
pl1 <- pl0 +
  stat_summary(aes(color = Group), fun.data = function(x) {
    return(data.frame(y = 0.98 * ceiling(max(plotdata$Index)), label = length(x)))
  }, geom = "text", hjust = 0.5, size = 4)

pl1
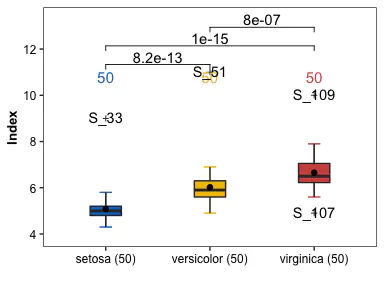
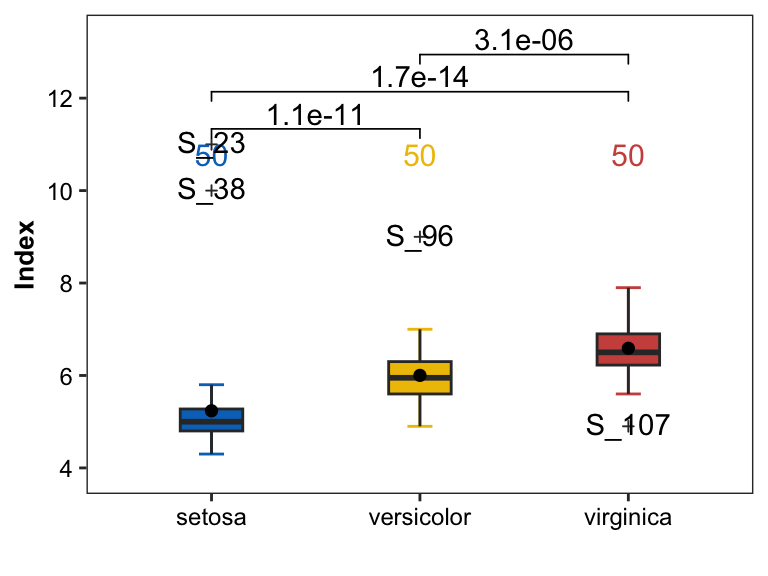
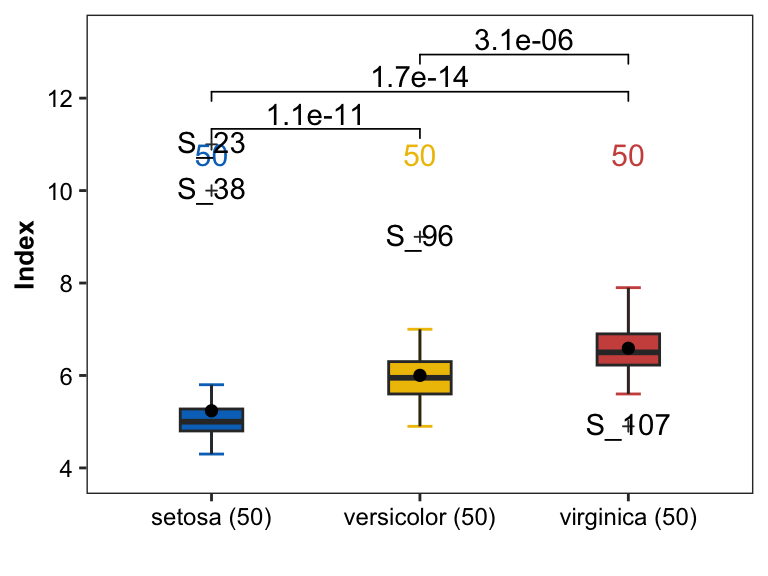
Marking outliers
is_outlierto determine the outliers by 1.5 fold IQRgeom_textto show the names of outliers
is_outlier <- function(x) {
  return(x < quantile(x, 0.25) - 1.5 * IQR(x) | x > quantile(x, 0.75) + 1.5 * IQR(x))
}

# 设置非离群点标签为NA
plotdata_outlier <- plotdata |>
  dplyr::group_by(Group) %>%
  dplyr::mutate(is_outlier = ifelse(is_outlier(Index), Index, as.numeric(NA)))

plotdata_outlier$SampleID[which(is.na(plotdata_outlier$is_outlier))] <- as.numeric(NA)


pl2 <- ggplot(plotdata_outlier, aes(x = Group, y = Index, fill = Group)) +
  stat_boxplot(aes(color = Group), geom = "errorbar", width = .12) +
  geom_boxplot(width = .3, outlier.shape = 3, outlier.size = 1) +
  stat_summary(fun = mean, geom = "point", shape = 16,
               size = 2, color = "black") +
  stat_summary(aes(color = Group), fun.data = function(x) {
    return(data.frame(y = 0.98 * ceiling(max(plotdata_outlier$Index)), label = length(x)))
  }, geom = "text", hjust = 0.5, size = 4) +
  geom_text(aes(label = SampleID), na.rm = TRUE, nudge_y = 0.05) +
  guides(fill = "none", color = "none") +
  stat_compare_means(comparisons = cmp,
                     method = "wilcox.test",
                     label = "p.label") +
  labs(x = "") +
  theme_bw() +
  scale_fill_manual(values = group_colors) +
  scale_color_manual(values = group_colors)+
  scale_y_continuous(expand = expansion(mult = c(0.1, 0.1))) +
  theme(plot.title = element_text(size = 10, color = "black", face = "bold", hjust = 0.5),
        axis.title = element_text(size = 10, color = "black", face = "bold"),
        axis.text = element_text(size = 9, color = "black"),
        text = element_text(size = 8, color = "black"),
        strip.text = element_text(size = 9, color = "black", face = "bold"),
        panel.grid = element_blank())

pl2
X labels with groups’ number
run_summarySEto calculate the number of groupsscale_x_discreteto change the x label
run_summarySE <- function(
    data,
    measurevar,
    groupvars = NULL,
    na.rm = FALSE,
    conf.interval = 0.95,
    .drop = TRUE) {

  length2 <- function (x, na.rm = FALSE) {
    if (na.rm) {
      sum(!is.na(x))
    } else {
      length(x)
    }
  }
  datac <- plyr::ddply(data, groupvars, .drop=.drop,
                 .fun= function(xx, col, na.rm) {
                   c( N    = length2(xx[,col], na.rm=na.rm),
                      mean = mean   (xx[,col], na.rm=na.rm),
                      sd   = sd     (xx[,col], na.rm=na.rm)
                   )
                 },
                 measurevar,
                 na.rm
  )

  datac$se <- datac$sd / sqrt(datac$N)
  ciMult <- qt(conf.interval / 2 + .5, datac$N-1)
  datac$ci <- datac$se * ciMult

  return(datac)
}

group_sum_value <- run_summarySE(plotdata, measurevar = "Index", groupvars = "Group")
x_axis_label <- paste0(group_sum_value$Group, " (", group_sum_value$N, ")")

pl3 <- ggplot(plotdata_outlier, aes(x = Group, y = Index, fill = Group)) +
  stat_boxplot(aes(color = Group), geom = "errorbar", width = .12) +
  geom_boxplot(width = .3, outlier.shape = 3, outlier.size = 1) +
  stat_summary(fun = mean, geom = "point", shape = 16,
               size = 2, color = "black") +
  stat_summary(aes(color = Group), fun.data = function(x) {
    return(data.frame(y = 0.98 * ceiling(max(plotdata_outlier$Index)), label = length(x)))
  }, geom = "text", hjust = 0.5, size = 4) +
  geom_text(aes(label = SampleID), na.rm = TRUE, nudge_y = 0.05) +
  guides(fill = "none", color = "none") +
  stat_compare_means(comparisons = cmp,
                     method = "wilcox.test",
                     label = "p.label") +
  labs(x = "") +
  theme_bw() +
  scale_fill_manual(values = group_colors) +
  scale_color_manual(values = group_colors)+
  scale_y_continuous(expand = expansion(mult = c(0.1, 0.1))) +
  scale_x_discrete(breaks = group_names,
                   labels = x_axis_label) +
  theme(plot.title = element_text(size = 10, color = "black", face = "bold", hjust = 0.5),
        axis.title = element_text(size = 10, color = "black", face = "bold"),
        axis.text = element_text(size = 9, color = "black"),
        text = element_text(size = 8, color = "black"),
        strip.text = element_text(size = 9, color = "black", face = "bold"),
        panel.grid = element_blank())

pl3
Conclusion
Compared to single boxplot, boxplot with outliers’ names and groups’ number provides more information.
Systemic information
devtools::session_info()
## ─ Session info ───────────────────────────────────────────────────────────────
##  setting  value
##  version  R version 4.1.3 (2022-03-10)
##  os       macOS Big Sur/Monterey 10.16
##  system   x86_64, darwin17.0
##  ui       X11
##  language (EN)
##  collate  en_US.UTF-8
##  ctype    en_US.UTF-8
##  tz       Asia/Shanghai
##  date     2023-07-28
##  pandoc   3.1.3 @ /Users/zouhua/opt/anaconda3/bin/ (via rmarkdown)
##
## ─ Packages ───────────────────────────────────────────────────────────────────
##  package     * version date (UTC) lib source
##  abind         1.4-5   2016-07-21 [2] CRAN (R 4.1.0)
##  backports     1.4.1   2021-12-13 [2] CRAN (R 4.1.0)
##  blogdown      1.18    2023-06-19 [2] CRAN (R 4.1.3)
##  bookdown      0.34    2023-05-09 [2] CRAN (R 4.1.2)
##  broom         1.0.5   2023-06-09 [2] CRAN (R 4.1.3)
##  bslib         0.5.0   2023-06-09 [2] CRAN (R 4.1.3)
##  cachem        1.0.8   2023-05-01 [2] CRAN (R 4.1.2)
##  callr         3.7.3   2022-11-02 [2] CRAN (R 4.1.2)
##  car           3.1-2   2023-03-30 [2] CRAN (R 4.1.2)
##  carData       3.0-5   2022-01-06 [2] CRAN (R 4.1.2)
##  cli           3.6.1   2023-03-23 [2] CRAN (R 4.1.2)
##  colorspace    2.1-0   2023-01-23 [2] CRAN (R 4.1.2)
##  crayon        1.5.2   2022-09-29 [2] CRAN (R 4.1.2)
##  devtools      2.4.5   2022-10-11 [2] CRAN (R 4.1.2)
##  digest        0.6.33  2023-07-07 [1] CRAN (R 4.1.3)
##  dplyr       * 1.1.2   2023-04-20 [2] CRAN (R 4.1.2)
##  ellipsis      0.3.2   2021-04-29 [2] CRAN (R 4.1.0)
##  evaluate      0.21    2023-05-05 [2] CRAN (R 4.1.2)
##  fansi         1.0.4   2023-01-22 [2] CRAN (R 4.1.2)
##  farver        2.1.1   2022-07-06 [2] CRAN (R 4.1.2)
##  fastmap       1.1.1   2023-02-24 [2] CRAN (R 4.1.2)
##  forcats     * 1.0.0   2023-01-29 [2] CRAN (R 4.1.2)
##  fs            1.6.2   2023-04-25 [2] CRAN (R 4.1.2)
##  generics      0.1.3   2022-07-05 [2] CRAN (R 4.1.2)
##  ggplot2     * 3.4.2   2023-04-03 [2] CRAN (R 4.1.2)
##  ggpubr      * 0.6.0   2023-02-10 [2] CRAN (R 4.1.2)
##  ggsignif      0.6.4   2022-10-13 [2] CRAN (R 4.1.2)
##  glue          1.6.2   2022-02-24 [2] CRAN (R 4.1.2)
##  gtable        0.3.3   2023-03-21 [2] CRAN (R 4.1.2)
##  highr         0.10    2022-12-22 [2] CRAN (R 4.1.2)
##  hms           1.1.3   2023-03-21 [2] CRAN (R 4.1.2)
##  htmltools     0.5.5   2023-03-23 [2] CRAN (R 4.1.2)
##  htmlwidgets   1.6.2   2023-03-17 [2] CRAN (R 4.1.2)
##  httpuv        1.6.11  2023-05-11 [2] CRAN (R 4.1.3)
##  jquerylib     0.1.4   2021-04-26 [2] CRAN (R 4.1.0)
##  jsonlite      1.8.7   2023-06-29 [2] CRAN (R 4.1.3)
##  knitr         1.43    2023-05-25 [2] CRAN (R 4.1.3)
##  labeling      0.4.2   2020-10-20 [2] CRAN (R 4.1.0)
##  later         1.3.1   2023-05-02 [2] CRAN (R 4.1.2)
##  lifecycle     1.0.3   2022-10-07 [2] CRAN (R 4.1.2)
##  lubridate   * 1.9.2   2023-02-10 [2] CRAN (R 4.1.2)
##  magrittr      2.0.3   2022-03-30 [2] CRAN (R 4.1.2)
##  memoise       2.0.1   2021-11-26 [2] CRAN (R 4.1.0)
##  mime          0.12    2021-09-28 [2] CRAN (R 4.1.0)
##  miniUI        0.1.1.1 2018-05-18 [2] CRAN (R 4.1.0)
##  munsell       0.5.0   2018-06-12 [2] CRAN (R 4.1.0)
##  pillar        1.9.0   2023-03-22 [2] CRAN (R 4.1.2)
##  pkgbuild      1.4.2   2023-06-26 [2] CRAN (R 4.1.3)
##  pkgconfig     2.0.3   2019-09-22 [2] CRAN (R 4.1.0)
##  pkgload       1.3.2.1 2023-07-08 [2] CRAN (R 4.1.3)
##  plyr          1.8.8   2022-11-11 [2] CRAN (R 4.1.2)
##  prettyunits   1.1.1   2020-01-24 [2] CRAN (R 4.1.0)
##  processx      3.8.2   2023-06-30 [2] CRAN (R 4.1.3)
##  profvis       0.3.8   2023-05-02 [2] CRAN (R 4.1.2)
##  promises      1.2.0.1 2021-02-11 [2] CRAN (R 4.1.0)
##  ps            1.7.5   2023-04-18 [2] CRAN (R 4.1.2)
##  purrr       * 1.0.1   2023-01-10 [2] CRAN (R 4.1.2)
##  R6            2.5.1   2021-08-19 [2] CRAN (R 4.1.0)
##  Rcpp          1.0.11  2023-07-06 [1] CRAN (R 4.1.3)
##  readr       * 2.1.4   2023-02-10 [2] CRAN (R 4.1.2)
##  remotes       2.4.2   2021-11-30 [2] CRAN (R 4.1.0)
##  rlang         1.1.1   2023-04-28 [2] CRAN (R 4.1.2)
##  rmarkdown     2.23    2023-07-01 [2] CRAN (R 4.1.3)
##  rstatix       0.7.2   2023-02-01 [2] CRAN (R 4.1.2)
##  rstudioapi    0.15.0  2023-07-07 [2] CRAN (R 4.1.3)
##  sass          0.4.6   2023-05-03 [2] CRAN (R 4.1.2)
##  scales        1.2.1   2022-08-20 [2] CRAN (R 4.1.2)
##  sessioninfo   1.2.2   2021-12-06 [2] CRAN (R 4.1.0)
##  shiny         1.7.4.1 2023-07-06 [2] CRAN (R 4.1.3)
##  stringi       1.7.12  2023-01-11 [2] CRAN (R 4.1.2)
##  stringr     * 1.5.0   2022-12-02 [2] CRAN (R 4.1.2)
##  tibble      * 3.2.1   2023-03-20 [2] CRAN (R 4.1.2)
##  tidyr       * 1.3.0   2023-01-24 [2] CRAN (R 4.1.2)
##  tidyselect    1.2.0   2022-10-10 [2] CRAN (R 4.1.2)
##  tidyverse   * 2.0.0   2023-02-22 [1] CRAN (R 4.1.2)
##  timechange    0.2.0   2023-01-11 [2] CRAN (R 4.1.2)
##  tzdb          0.4.0   2023-05-12 [2] CRAN (R 4.1.3)
##  urlchecker    1.0.1   2021-11-30 [2] CRAN (R 4.1.0)
##  usethis       2.2.2   2023-07-06 [2] CRAN (R 4.1.3)
##  utf8          1.2.3   2023-01-31 [2] CRAN (R 4.1.2)
##  vctrs         0.6.3   2023-06-14 [1] CRAN (R 4.1.3)
##  withr         2.5.0   2022-03-03 [2] CRAN (R 4.1.2)
##  xfun          0.39    2023-04-20 [2] CRAN (R 4.1.2)
##  xtable        1.8-4   2019-04-21 [2] CRAN (R 4.1.0)
##  yaml          2.3.7   2023-01-23 [2] CRAN (R 4.1.2)
##
##  [1] /Users/zouhua/Library/R/x86_64/4.1/library
##  [2] /Library/Frameworks/R.framework/Versions/4.1/Resources/library
##
## ──────────────────────────────────────────────────────────────────────────────
Hua Zou
Senior Bioinformatic Analyst
My research interests include host-microbiota intersection, machine learning and multi-omics data integration.