R visualization: errorbar by ggplot2
errorbar with point
Introduction
Errorbar with jitter gives intuitive sense to observe the differences among groups.
Loading required packages
knitr::opts_chunk$set(message = FALSE, warning = FALSE)

library(tidyverse)
library(ggpubr)

rm(list = ls())
options(stringsAsFactors = F)

# group & color
group_names <- c("setosa", "versicolor", "virginica")
group_colors <- c("#0073C2FF", "#EFC000FF", "#CD534CFF")
Data preparation
Loading iris and ToothGrowth dataset
Factorizing Species
data("iris")

plotdata <- iris |>
  dplyr::select(Sepal.Length, Species) |>
  dplyr::mutate(Species = factor(Species, levels = group_names)) |>
  dplyr::rename(Group = Species,
                Index = Sepal.Length)

head(plotdata)
##   Index  Group
## 1   5.1 setosa
## 2   4.9 setosa
## 3   4.7 setosa
## 4   4.6 setosa
## 5   5.0 setosa
## 6   5.4 setosa
# other dataset
data("ToothGrowth")
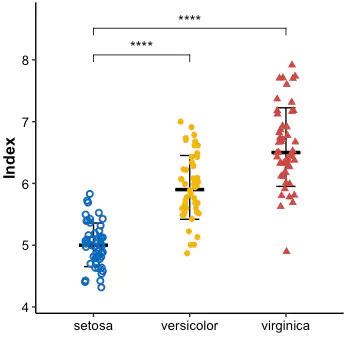
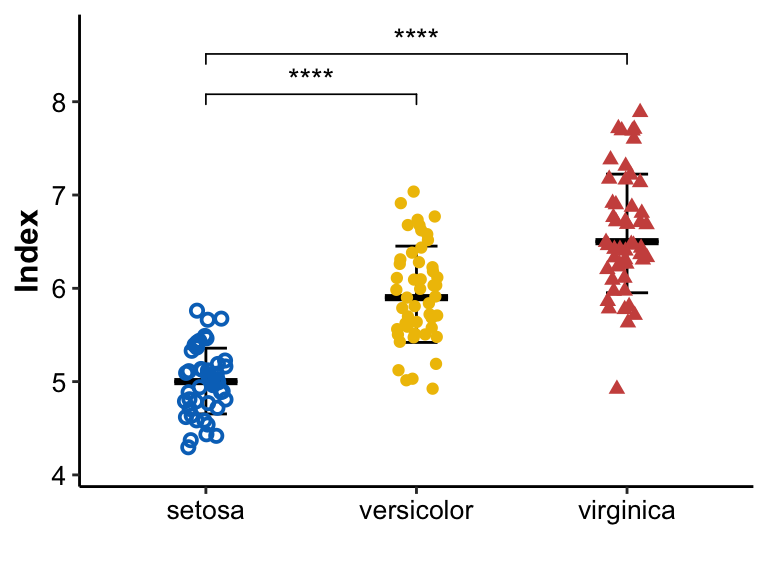
errorbar with points
create error bar by
stat_summaryusing errorbaradd point by
geom_point
pl <- ggplot(data = plotdata, aes(x = Group, y = Index, shape = Group)) +
  stat_summary(fun.data = mean_sdl, fun.args = list(mult = 1),
               geom = "errorbar", width = 0.2) +
  stat_summary(fun = median, fun.min = median, fun.max = median,
               geom = "crossbar", width = 0.3) +
  geom_point(aes(color = Group), position = position_jitter(width = 0.1),
             size = 1.5, stroke = 1) +
  stat_compare_means(comparisons = list(c("setosa", "versicolor"),
                                        c("setosa", "virginica")),
                     method = "t.test",
                     label = "p.signif") +
  labs(x = "") +
  scale_y_continuous(expand = expansion(mult = c(0.1, 0.1))) +
  scale_color_manual(values = group_colors) +
  scale_shape_manual(values = c(1, 16, 17)) +
  guides(color = "none", shape = "none", fill = "none") +
  theme_classic() +
  theme(axis.title = element_text(size = 12, color = "black", face = "bold"),
        axis.text = element_text(size = 10, color = "black"),
        text = element_text(size = 9, color = "black"))

pl
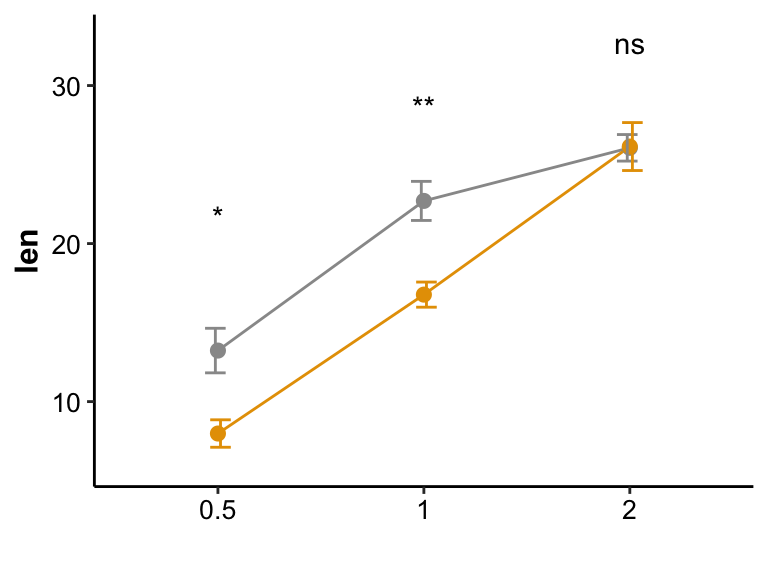
Errorbar with line
- Using ToothGrowth dataset with groups Dose and supp
ToothGrowth$dose <- factor(ToothGrowth$dose)

data_summary <- function(data, varname, groupnames){

  require(plyr)

  summary_func <- function(x, col) {
    mean_value <- mean(x[[col]], na.rm = TRUE)
    sd_value <- sd(x[[col]], na.rm = TRUE)
    length_n <- length(x[[col]])

    # standard error= standard deviation/squareroot(n)
    se_value <- sd_value / sqrt(length_n)

    return(c(mean = mean_value, sd = sd_value, se = se_value))
  }

  data_sum <- ddply(data, groupnames, .fun=summary_func, varname)
  data_sum <- rename(data_sum, c("mean" = varname))

  return(data_sum)
}

plotdata2 <- data_summary(
  ToothGrowth,
  varname = "len",
  groupnames = c("supp", "dose"))

pl2 <- ggplot(data = plotdata2, aes(x = dose, y = len, group = supp, color = supp)) +
  geom_line() +
  geom_point(size = 1.5, stroke = 1) +
  # geom_errorbar(aes(ymin = len - sd, ymax = len + sd), width = .2,
  #                  position = position_dodge(0.05)) +
  geom_errorbar(aes(ymin = len - se, ymax = len + se), width = .2,
                   position = position_dodge(0.05)) +
  stat_compare_means(data = ToothGrowth,
                     aes(x = dose, y = len, group = supp),
                     label = "p.signif",
                     label.y = c(21, 28, 32)) +
  labs(x = "") +
  scale_y_continuous(expand = expansion(mult = c(0.1, 0.1))) +
  scale_color_manual(values = c("#999999","#E69F00")) +
  guides(color = "none") +
  theme_classic() +
  theme(axis.title = element_text(size = 12, color = "black", face = "bold"),
        axis.text = element_text(size = 10, color = "black"),
        text = element_text(size = 9, color = "black"))

pl2
Conclusion
Compared to single boxplot, Errorbar with jitter provides more information.
Systemic information
devtools::session_info()
## ─ Session info ───────────────────────────────────────────────────────────────
##  setting  value
##  version  R version 4.1.3 (2022-03-10)
##  os       macOS Big Sur/Monterey 10.16
##  system   x86_64, darwin17.0
##  ui       X11
##  language (EN)
##  collate  en_US.UTF-8
##  ctype    en_US.UTF-8
##  tz       Asia/Shanghai
##  date     2023-07-24
##  pandoc   3.1.3 @ /Users/zouhua/opt/anaconda3/bin/ (via rmarkdown)
##
## ─ Packages ───────────────────────────────────────────────────────────────────
##  package     * version date (UTC) lib source
##  abind         1.4-5   2016-07-21 [2] CRAN (R 4.1.0)
##  backports     1.4.1   2021-12-13 [2] CRAN (R 4.1.0)
##  base64enc     0.1-3   2015-07-28 [2] CRAN (R 4.1.0)
##  blogdown      1.18    2023-06-19 [2] CRAN (R 4.1.3)
##  bookdown      0.34    2023-05-09 [2] CRAN (R 4.1.2)
##  broom         1.0.5   2023-06-09 [2] CRAN (R 4.1.3)
##  bslib         0.5.0   2023-06-09 [2] CRAN (R 4.1.3)
##  cachem        1.0.8   2023-05-01 [2] CRAN (R 4.1.2)
##  callr         3.7.3   2022-11-02 [2] CRAN (R 4.1.2)
##  car           3.1-2   2023-03-30 [2] CRAN (R 4.1.2)
##  carData       3.0-5   2022-01-06 [2] CRAN (R 4.1.2)
##  checkmate     2.2.0   2023-04-27 [2] CRAN (R 4.1.2)
##  cli           3.6.1   2023-03-23 [2] CRAN (R 4.1.2)
##  cluster       2.1.4   2022-08-22 [2] CRAN (R 4.1.2)
##  colorspace    2.1-0   2023-01-23 [2] CRAN (R 4.1.2)
##  crayon        1.5.2   2022-09-29 [2] CRAN (R 4.1.2)
##  data.table    1.14.8  2023-02-17 [2] CRAN (R 4.1.2)
##  devtools      2.4.5   2022-10-11 [2] CRAN (R 4.1.2)
##  digest        0.6.33  2023-07-07 [1] CRAN (R 4.1.3)
##  dplyr       * 1.1.2   2023-04-20 [2] CRAN (R 4.1.2)
##  ellipsis      0.3.2   2021-04-29 [2] CRAN (R 4.1.0)
##  evaluate      0.21    2023-05-05 [2] CRAN (R 4.1.2)
##  fansi         1.0.4   2023-01-22 [2] CRAN (R 4.1.2)
##  farver        2.1.1   2022-07-06 [2] CRAN (R 4.1.2)
##  fastmap       1.1.1   2023-02-24 [2] CRAN (R 4.1.2)
##  forcats     * 1.0.0   2023-01-29 [2] CRAN (R 4.1.2)
##  foreign       0.8-84  2022-12-06 [2] CRAN (R 4.1.2)
##  Formula       1.2-5   2023-02-24 [2] CRAN (R 4.1.2)
##  fs            1.6.2   2023-04-25 [2] CRAN (R 4.1.2)
##  generics      0.1.3   2022-07-05 [2] CRAN (R 4.1.2)
##  ggplot2     * 3.4.2   2023-04-03 [2] CRAN (R 4.1.2)
##  ggpubr      * 0.6.0   2023-02-10 [2] CRAN (R 4.1.2)
##  ggsignif      0.6.4   2022-10-13 [2] CRAN (R 4.1.2)
##  glue          1.6.2   2022-02-24 [2] CRAN (R 4.1.2)
##  gridExtra     2.3     2017-09-09 [2] CRAN (R 4.1.0)
##  gtable        0.3.3   2023-03-21 [2] CRAN (R 4.1.2)
##  highr         0.10    2022-12-22 [2] CRAN (R 4.1.2)
##  Hmisc         5.1-0   2023-05-08 [2] CRAN (R 4.1.2)
##  hms           1.1.3   2023-03-21 [2] CRAN (R 4.1.2)
##  htmlTable     2.4.1   2022-07-07 [2] CRAN (R 4.1.2)
##  htmltools     0.5.5   2023-03-23 [2] CRAN (R 4.1.2)
##  htmlwidgets   1.6.2   2023-03-17 [2] CRAN (R 4.1.2)
##  httpuv        1.6.11  2023-05-11 [2] CRAN (R 4.1.3)
##  jquerylib     0.1.4   2021-04-26 [2] CRAN (R 4.1.0)
##  jsonlite      1.8.7   2023-06-29 [2] CRAN (R 4.1.3)
##  knitr         1.43    2023-05-25 [2] CRAN (R 4.1.3)
##  labeling      0.4.2   2020-10-20 [2] CRAN (R 4.1.0)
##  later         1.3.1   2023-05-02 [2] CRAN (R 4.1.2)
##  lifecycle     1.0.3   2022-10-07 [2] CRAN (R 4.1.2)
##  lubridate   * 1.9.2   2023-02-10 [2] CRAN (R 4.1.2)
##  magrittr      2.0.3   2022-03-30 [2] CRAN (R 4.1.2)
##  memoise       2.0.1   2021-11-26 [2] CRAN (R 4.1.0)
##  mime          0.12    2021-09-28 [2] CRAN (R 4.1.0)
##  miniUI        0.1.1.1 2018-05-18 [2] CRAN (R 4.1.0)
##  munsell       0.5.0   2018-06-12 [2] CRAN (R 4.1.0)
##  nnet          7.3-19  2023-05-03 [2] CRAN (R 4.1.2)
##  pillar        1.9.0   2023-03-22 [2] CRAN (R 4.1.2)
##  pkgbuild      1.4.2   2023-06-26 [2] CRAN (R 4.1.3)
##  pkgconfig     2.0.3   2019-09-22 [2] CRAN (R 4.1.0)
##  pkgload       1.3.2.1 2023-07-08 [2] CRAN (R 4.1.3)
##  plyr        * 1.8.8   2022-11-11 [2] CRAN (R 4.1.2)
##  prettyunits   1.1.1   2020-01-24 [2] CRAN (R 4.1.0)
##  processx      3.8.2   2023-06-30 [2] CRAN (R 4.1.3)
##  profvis       0.3.8   2023-05-02 [2] CRAN (R 4.1.2)
##  promises      1.2.0.1 2021-02-11 [2] CRAN (R 4.1.0)
##  ps            1.7.5   2023-04-18 [2] CRAN (R 4.1.2)
##  purrr       * 1.0.1   2023-01-10 [2] CRAN (R 4.1.2)
##  R6            2.5.1   2021-08-19 [2] CRAN (R 4.1.0)
##  Rcpp          1.0.11  2023-07-06 [1] CRAN (R 4.1.3)
##  readr       * 2.1.4   2023-02-10 [2] CRAN (R 4.1.2)
##  remotes       2.4.2   2021-11-30 [2] CRAN (R 4.1.0)
##  rlang         1.1.1   2023-04-28 [2] CRAN (R 4.1.2)
##  rmarkdown     2.23    2023-07-01 [2] CRAN (R 4.1.3)
##  rpart         4.1.19  2022-10-21 [2] CRAN (R 4.1.2)
##  rstatix       0.7.2   2023-02-01 [2] CRAN (R 4.1.2)
##  rstudioapi    0.15.0  2023-07-07 [2] CRAN (R 4.1.3)
##  sass          0.4.6   2023-05-03 [2] CRAN (R 4.1.2)
##  scales        1.2.1   2022-08-20 [2] CRAN (R 4.1.2)
##  sessioninfo   1.2.2   2021-12-06 [2] CRAN (R 4.1.0)
##  shiny         1.7.4.1 2023-07-06 [2] CRAN (R 4.1.3)
##  stringi       1.7.12  2023-01-11 [2] CRAN (R 4.1.2)
##  stringr     * 1.5.0   2022-12-02 [2] CRAN (R 4.1.2)
##  tibble      * 3.2.1   2023-03-20 [2] CRAN (R 4.1.2)
##  tidyr       * 1.3.0   2023-01-24 [2] CRAN (R 4.1.2)
##  tidyselect    1.2.0   2022-10-10 [2] CRAN (R 4.1.2)
##  tidyverse   * 2.0.0   2023-02-22 [1] CRAN (R 4.1.2)
##  timechange    0.2.0   2023-01-11 [2] CRAN (R 4.1.2)
##  tzdb          0.4.0   2023-05-12 [2] CRAN (R 4.1.3)
##  urlchecker    1.0.1   2021-11-30 [2] CRAN (R 4.1.0)
##  usethis       2.2.2   2023-07-06 [2] CRAN (R 4.1.3)
##  utf8          1.2.3   2023-01-31 [2] CRAN (R 4.1.2)
##  vctrs         0.6.3   2023-06-14 [1] CRAN (R 4.1.3)
##  withr         2.5.0   2022-03-03 [2] CRAN (R 4.1.2)
##  xfun          0.39    2023-04-20 [2] CRAN (R 4.1.2)
##  xtable        1.8-4   2019-04-21 [2] CRAN (R 4.1.0)
##  yaml          2.3.7   2023-01-23 [2] CRAN (R 4.1.2)
##
##  [1] /Users/zouhua/Library/R/x86_64/4.1/library
##  [2] /Library/Frameworks/R.framework/Versions/4.1/Resources/library
##
## ──────────────────────────────────────────────────────────────────────────────
Reference
Hua Zou
Senior Bioinformatic Analyst
My research interests include host-microbiota intersection, machine learning and multi-omics data integration.