R visualization: Violin by ggplot2
Violin with boxplot and point
Introduction
Violin using the density of distribution to show the differences among groups is one of the most important means for data visualization.
Loading required packages
knitr::opts_chunk$set(message = FALSE, warning = FALSE)

library(tidyverse)
library(ggpubr)

# install.packages("gghalves")
library(gghalves)

rm(list = ls())
options(stringsAsFactors = F)

# group & color
group_names <- c("setosa", "versicolor", "virginica")
group_colors <- c("#0073C2FF", "#EFC000FF", "#CD534CFF")
Data preparation
Loading iris and ToothGrowth dataset
Factorizing Species
data("iris")

plotdata <- iris |>
  dplyr::select(Sepal.Length, Species, Sepal.Width) |>
  dplyr::mutate(Species = factor(Species, levels = group_names)) |>
  dplyr::rename(Group = Species,
                Index = Sepal.Length,
                Index2 = Sepal.Width)

head(plotdata)
##   Index  Group Index2
## 1   5.1 setosa    3.5
## 2   4.9 setosa    3.0
## 3   4.7 setosa    3.2
## 4   4.6 setosa    3.1
## 5   5.0 setosa    3.6
## 6   5.4 setosa    3.9
# other dataset
data("ToothGrowth")
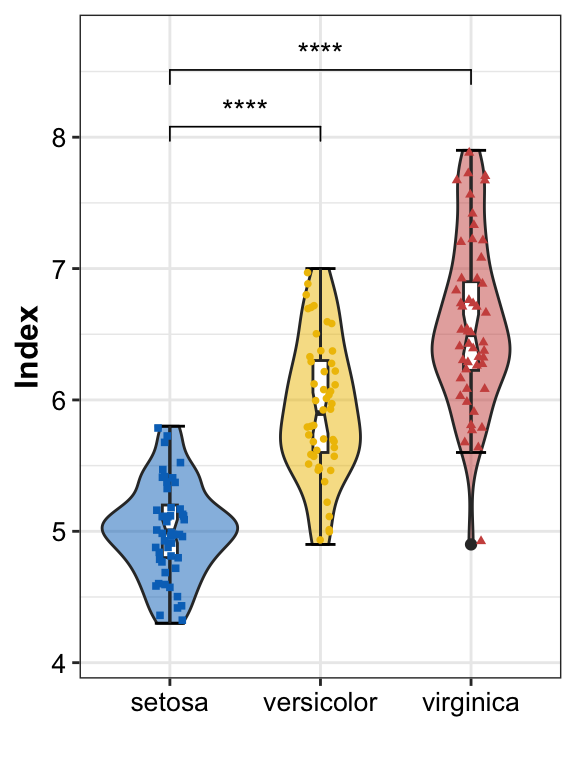
Single violin
create violin by
geom_violinapply
stat_boxplotandgeom_boxplotfor boxplotadd point by
geom_point
pl_violin <- ggplot(data = plotdata, aes(x = Group, y = Index, shape = Group)) +
  geom_violin(aes(fill = Group), alpha = 0.5) +
  stat_boxplot(geom = "errorbar", width = 0.2) +
  geom_boxplot(width = .1, notch = TRUE) +
  geom_point(aes(color = Group), position = position_jitter(width = 0.1), size = 1) +
  stat_compare_means(comparisons = list(c("setosa", "versicolor"),
                                        c("setosa", "virginica")),
                     method = "t.test",
                     label = "p.signif") +
  labs(x = "") +
  scale_y_continuous(expand = expansion(mult = c(0.1, 0.1))) +
  scale_color_manual(values = group_colors) +
  scale_fill_manual(values = group_colors) +
  scale_shape_manual(values = c(15, 16, 17)) +
  guides(color = "none", shape = "none", fill = "none") +
  theme_bw() +
  theme(axis.title = element_text(size = 12, color = "black", face = "bold"),
        axis.text = element_text(size = 10, color = "black"),
        text = element_text(size = 9, color = "black"))

pl_violin
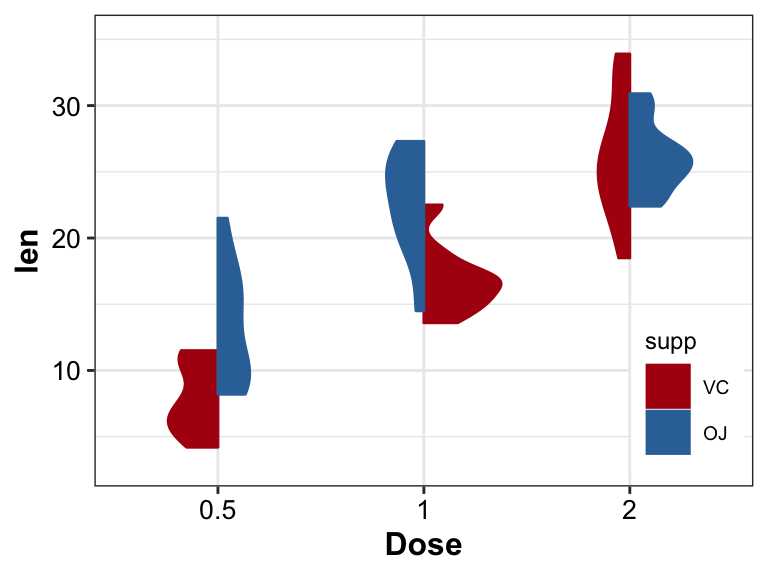
Violin with two different groups
The left part of violin is totally different from the right.
- Using ToothGrowth dataset with groups Dose and supp
pl_violin2 <- ToothGrowth |>
  dplyr::mutate(supp = factor(supp, levels = c("VC", "OJ"))) |>
  ggplot(aes(x = as.factor(dose), y = len)) +
  geom_half_violin(aes(fill = supp, color = supp, split = supp),
                   position = "identity") +
  labs(x = "Dose") +
  scale_y_continuous(expand = expansion(mult = c(0.1, 0.1))) +
  scale_color_manual(values = c("#AF0F11", "#3372A6")) +
  scale_fill_manual(values = c("#AF0F11", "#3372A6")) +
  theme_bw() +
  theme(axis.title = element_text(size = 12, color = "black", face = "bold"),
        axis.text = element_text(size = 10, color = "black"),
        text = element_text(size = 9, color = "black"),
        legend.position = c(.9, 0.2))

pl_violin2
- add significance between groups by
stat_compare_means
pl_violin2_1 <- pl_violin2 +
  stat_compare_means(aes(group = supp),
                     label = "p.signif",
                     label.y = (max(ToothGrowth$len) + max(ToothGrowth$len) * 0.1))

pl_violin2_1
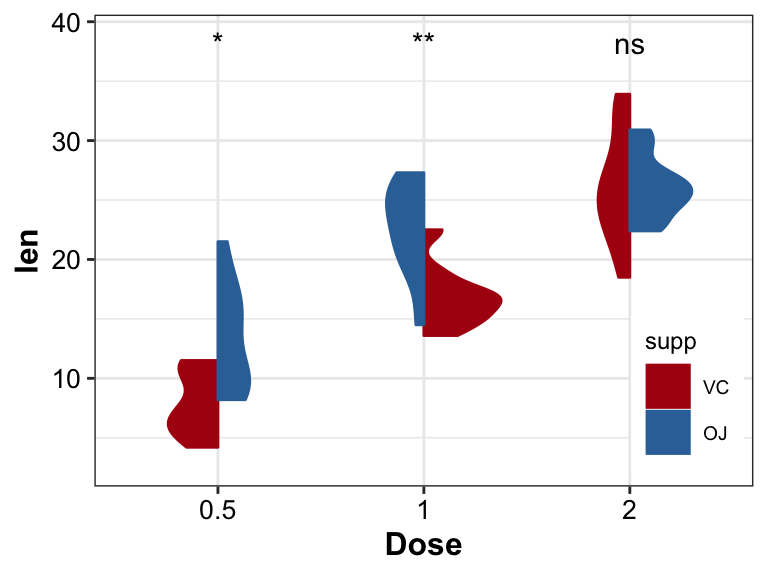
- add significance between groups by
ggsignif::geom_signif
library(ggsignif)

nlength <- length(unique(ToothGrowth$dose))
test_res <- ToothGrowth |>
  dplyr::mutate(dose = factor(dose)) |>
  dplyr::group_by(dose) |>
  rstatix::t_test(len ~ supp) |>
  rstatix::adjust_pvalue() |>
  rstatix::add_significance("p.adj") |>
  dplyr::mutate(x = seq(0.875, 0.875+(nlength-1)*1, 1),
                xend = seq(1.125, 1.125+(nlength-1)*1, 1),
                y = rep((max(ToothGrowth$len) + max(ToothGrowth$len) * 0.1), nlength))

pl_violin2_2 <- pl_violin2 +
  geom_signif(stat = "identity",
              data = test_res,
              aes(x = x,xend = xend, y = y, yend = y, annotation = p.adj.signif))

pl_violin2_2

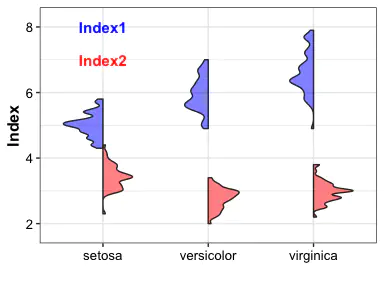
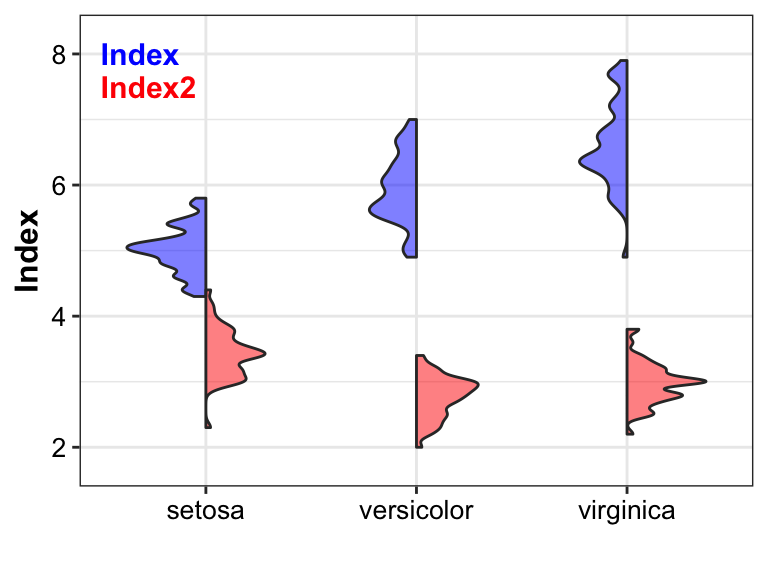
Violin with two different index
pl_violin3 <- ggplot(data = plotdata, aes(x = Group, y = Index)) +
  geom_half_violin(fill = "blue",
                   side = "l",
                   adjust = 0.5,
                   alpha = 0.5) +
  geom_half_violin(aes(y = Index2),
                   fill = "red",
                   side = "r",
                   adjust = 0.5,
                   alpha = 0.5) +
  labs(x = "") +
  annotate(x = 0.5, y = 8, geom = "text", label = "Index", color = "blue",
           size = 4, fontface = "bold", hjust = 0) +
  annotate(x = 0.5, y = 7.5, geom = "text", label = "Index2", color = "red",
           size = 4, fontface = "bold", hjust = 0) +
  scale_y_continuous(expand = expansion(mult = c(0.1, 0.1))) +
  theme_bw() +
  theme(axis.title = element_text(size = 12, color = "black", face = "bold"),
        axis.text = element_text(size = 10, color = "black"),
        text = element_text(size = 9, color = "black"))

pl_violin3
Conclusion
Compared to single boxplot, violin not only shows differences among group, but also displays the distribution of each value, providing more information.
Systemic information
devtools::session_info()
## ─ Session info ───────────────────────────────────────────────────────────────
##  setting  value
##  version  R version 4.1.3 (2022-03-10)
##  os       macOS Big Sur/Monterey 10.16
##  system   x86_64, darwin17.0
##  ui       X11
##  language (EN)
##  collate  en_US.UTF-8
##  ctype    en_US.UTF-8
##  tz       Asia/Shanghai
##  date     2023-07-24
##  pandoc   3.1.3 @ /Users/zouhua/opt/anaconda3/bin/ (via rmarkdown)
##
## ─ Packages ───────────────────────────────────────────────────────────────────
##  package     * version date (UTC) lib source
##  abind         1.4-5   2016-07-21 [2] CRAN (R 4.1.0)
##  backports     1.4.1   2021-12-13 [2] CRAN (R 4.1.0)
##  blogdown      1.18    2023-06-19 [2] CRAN (R 4.1.3)
##  bookdown      0.34    2023-05-09 [2] CRAN (R 4.1.2)
##  broom         1.0.5   2023-06-09 [2] CRAN (R 4.1.3)
##  bslib         0.5.0   2023-06-09 [2] CRAN (R 4.1.3)
##  cachem        1.0.8   2023-05-01 [2] CRAN (R 4.1.2)
##  callr         3.7.3   2022-11-02 [2] CRAN (R 4.1.2)
##  car           3.1-2   2023-03-30 [2] CRAN (R 4.1.2)
##  carData       3.0-5   2022-01-06 [2] CRAN (R 4.1.2)
##  cli           3.6.1   2023-03-23 [2] CRAN (R 4.1.2)
##  colorspace    2.1-0   2023-01-23 [2] CRAN (R 4.1.2)
##  crayon        1.5.2   2022-09-29 [2] CRAN (R 4.1.2)
##  devtools      2.4.5   2022-10-11 [2] CRAN (R 4.1.2)
##  digest        0.6.33  2023-07-07 [1] CRAN (R 4.1.3)
##  dplyr       * 1.1.2   2023-04-20 [2] CRAN (R 4.1.2)
##  ellipsis      0.3.2   2021-04-29 [2] CRAN (R 4.1.0)
##  evaluate      0.21    2023-05-05 [2] CRAN (R 4.1.2)
##  fansi         1.0.4   2023-01-22 [2] CRAN (R 4.1.2)
##  farver        2.1.1   2022-07-06 [2] CRAN (R 4.1.2)
##  fastmap       1.1.1   2023-02-24 [2] CRAN (R 4.1.2)
##  forcats     * 1.0.0   2023-01-29 [2] CRAN (R 4.1.2)
##  fs            1.6.2   2023-04-25 [2] CRAN (R 4.1.2)
##  generics      0.1.3   2022-07-05 [2] CRAN (R 4.1.2)
##  gghalves    * 0.1.4   2022-11-20 [1] CRAN (R 4.1.2)
##  ggplot2     * 3.4.2   2023-04-03 [2] CRAN (R 4.1.2)
##  ggpubr      * 0.6.0   2023-02-10 [2] CRAN (R 4.1.2)
##  ggsignif    * 0.6.4   2022-10-13 [2] CRAN (R 4.1.2)
##  glue          1.6.2   2022-02-24 [2] CRAN (R 4.1.2)
##  gtable        0.3.3   2023-03-21 [2] CRAN (R 4.1.2)
##  highr         0.10    2022-12-22 [2] CRAN (R 4.1.2)
##  hms           1.1.3   2023-03-21 [2] CRAN (R 4.1.2)
##  htmltools     0.5.5   2023-03-23 [2] CRAN (R 4.1.2)
##  htmlwidgets   1.6.2   2023-03-17 [2] CRAN (R 4.1.2)
##  httpuv        1.6.11  2023-05-11 [2] CRAN (R 4.1.3)
##  jquerylib     0.1.4   2021-04-26 [2] CRAN (R 4.1.0)
##  jsonlite      1.8.7   2023-06-29 [2] CRAN (R 4.1.3)
##  knitr         1.43    2023-05-25 [2] CRAN (R 4.1.3)
##  labeling      0.4.2   2020-10-20 [2] CRAN (R 4.1.0)
##  later         1.3.1   2023-05-02 [2] CRAN (R 4.1.2)
##  lifecycle     1.0.3   2022-10-07 [2] CRAN (R 4.1.2)
##  lubridate   * 1.9.2   2023-02-10 [2] CRAN (R 4.1.2)
##  magrittr      2.0.3   2022-03-30 [2] CRAN (R 4.1.2)
##  memoise       2.0.1   2021-11-26 [2] CRAN (R 4.1.0)
##  mime          0.12    2021-09-28 [2] CRAN (R 4.1.0)
##  miniUI        0.1.1.1 2018-05-18 [2] CRAN (R 4.1.0)
##  munsell       0.5.0   2018-06-12 [2] CRAN (R 4.1.0)
##  pillar        1.9.0   2023-03-22 [2] CRAN (R 4.1.2)
##  pkgbuild      1.4.2   2023-06-26 [2] CRAN (R 4.1.3)
##  pkgconfig     2.0.3   2019-09-22 [2] CRAN (R 4.1.0)
##  pkgload       1.3.2.1 2023-07-08 [2] CRAN (R 4.1.3)
##  prettyunits   1.1.1   2020-01-24 [2] CRAN (R 4.1.0)
##  processx      3.8.2   2023-06-30 [2] CRAN (R 4.1.3)
##  profvis       0.3.8   2023-05-02 [2] CRAN (R 4.1.2)
##  promises      1.2.0.1 2021-02-11 [2] CRAN (R 4.1.0)
##  ps            1.7.5   2023-04-18 [2] CRAN (R 4.1.2)
##  purrr       * 1.0.1   2023-01-10 [2] CRAN (R 4.1.2)
##  R6            2.5.1   2021-08-19 [2] CRAN (R 4.1.0)
##  Rcpp          1.0.11  2023-07-06 [1] CRAN (R 4.1.3)
##  readr       * 2.1.4   2023-02-10 [2] CRAN (R 4.1.2)
##  remotes       2.4.2   2021-11-30 [2] CRAN (R 4.1.0)
##  rlang         1.1.1   2023-04-28 [2] CRAN (R 4.1.2)
##  rmarkdown     2.23    2023-07-01 [2] CRAN (R 4.1.3)
##  rstatix       0.7.2   2023-02-01 [2] CRAN (R 4.1.2)
##  rstudioapi    0.15.0  2023-07-07 [2] CRAN (R 4.1.3)
##  sass          0.4.6   2023-05-03 [2] CRAN (R 4.1.2)
##  scales        1.2.1   2022-08-20 [2] CRAN (R 4.1.2)
##  sessioninfo   1.2.2   2021-12-06 [2] CRAN (R 4.1.0)
##  shiny         1.7.4.1 2023-07-06 [2] CRAN (R 4.1.3)
##  stringi       1.7.12  2023-01-11 [2] CRAN (R 4.1.2)
##  stringr     * 1.5.0   2022-12-02 [2] CRAN (R 4.1.2)
##  tibble      * 3.2.1   2023-03-20 [2] CRAN (R 4.1.2)
##  tidyr       * 1.3.0   2023-01-24 [2] CRAN (R 4.1.2)
##  tidyselect    1.2.0   2022-10-10 [2] CRAN (R 4.1.2)
##  tidyverse   * 2.0.0   2023-02-22 [1] CRAN (R 4.1.2)
##  timechange    0.2.0   2023-01-11 [2] CRAN (R 4.1.2)
##  tzdb          0.4.0   2023-05-12 [2] CRAN (R 4.1.3)
##  urlchecker    1.0.1   2021-11-30 [2] CRAN (R 4.1.0)
##  usethis       2.2.2   2023-07-06 [2] CRAN (R 4.1.3)
##  utf8          1.2.3   2023-01-31 [2] CRAN (R 4.1.2)
##  vctrs         0.6.3   2023-06-14 [1] CRAN (R 4.1.3)
##  withr         2.5.0   2022-03-03 [2] CRAN (R 4.1.2)
##  xfun          0.39    2023-04-20 [2] CRAN (R 4.1.2)
##  xtable        1.8-4   2019-04-21 [2] CRAN (R 4.1.0)
##  yaml          2.3.7   2023-01-23 [2] CRAN (R 4.1.2)
##
##  [1] /Users/zouhua/Library/R/x86_64/4.1/library
##  [2] /Library/Frameworks/R.framework/Versions/4.1/Resources/library
##
## ──────────────────────────────────────────────────────────────────────────────
Reference
Hua Zou
Senior Bioinformatic Analyst
My research interests include host-microbiota intersection, machine learning and multi-omics data integration.