R visualization: boxplot with points labeled in percentage by ggplot2
Boxplot with percentage per group
Introduction
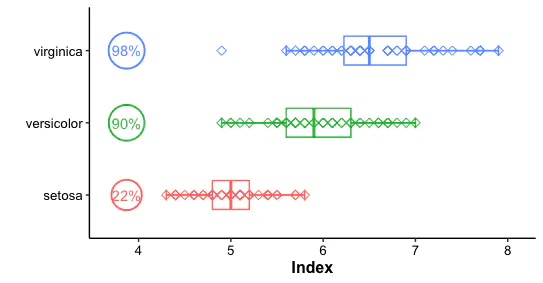
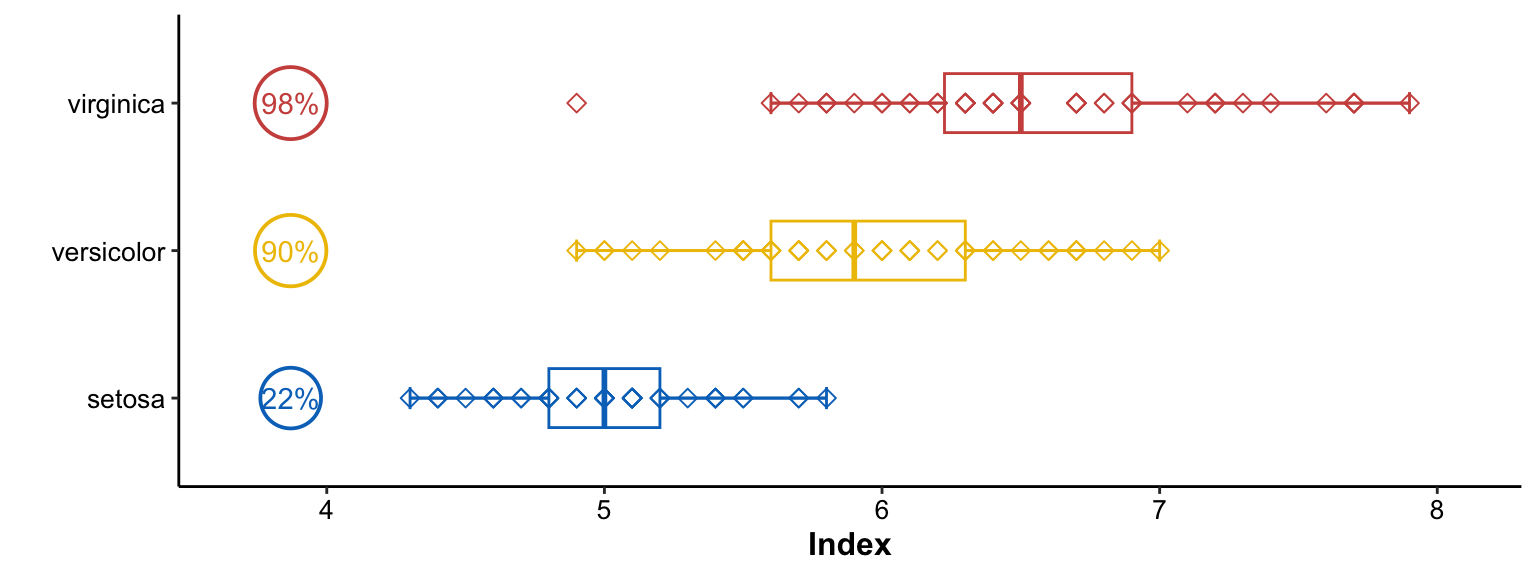
The simple boxplot only shows the distribution of values per group. However, more information should be displayed in one figure. Here, using points determined by proportion and we could observe the percentage of index per group.
Loading required packages
knitr::opts_chunk$set(message = FALSE, warning = FALSE)
library(tidyverse)

rm(list = ls())
options(stringsAsFactors = F)

# group & color
group_names <- c("setosa", "versicolor", "virginica")
group_colors <- c("#0073C2FF", "#EFC000FF", "#CD534CFF")
Data preparation
Loading iris dataset
Calculating ratio per species (Occurrence)
data("iris")

plotdata <- iris |>
  dplyr::select(Sepal.Length, Species) |>
  dplyr::mutate(Species = factor(Species, levels = group_names)) |>
  dplyr::rename(Group = Species,
                Index = Sepal.Length)

# threshold for prevalence
occ_cutoff <- 5.2
occ_fun <- function(x) {
  return(round(length(x[x > occ_cutoff])/length(x), 4))
}

plotOcc <- plotdata |>
  dplyr::group_by(Group) |>
  dplyr::summarise(occ = occ_fun(Index)) |>
  dplyr::mutate(occ_lab = paste0(occ * 100, "%")) |>
  dplyr::mutate(position = min(plotdata$Index) - min(plotdata$Index) * 0.1)

head(plotOcc)
## # A tibble: 3 × 4
##   Group        occ occ_lab position
##   <fct>      <dbl> <chr>      <dbl>
## 1 setosa      0.22 22%         3.87
## 2 versicolor  0.9  90%         3.87
## 3 virginica   0.98 98%         3.87
Plotting
Create boxplot with errorbar using key functions:
stat_boxplot,geom_boxplot.Add points:
geom_pointfor values and percentages, respectively.Apply
geom_textto display the text of Ratio.
pl <- ggplot(data = plotdata, aes(x = Group, y = Index, color = Group)) +
  stat_boxplot(geom = "errorbar", width = 0.15) +
  geom_boxplot(width = .4, outlier.shape = NA) +
  geom_point(size = 2, shape = 5) +
  labs(x = "") +
  scale_y_continuous(expand = expansion(mult = c(0.1, 0.1))) +
  geom_point(data = plotOcc, aes(x = Group, y = position, size = occ),
             show.legend = FALSE, shape = 1, stroke = 1) +
  geom_text(data = plotOcc, aes(x = Group, y = position, label = occ_lab),
            show.legend = FALSE) +
  scale_size_continuous(range = c(10, 12)) +
  scale_color_manual(values = group_colors) +
  coord_flip() +
  guides(color = "none") +
  theme_classic() +
  theme(axis.title = element_text(size = 12, color = "black", face = "bold"),
        axis.text = element_text(size = 10, color = "black"),
        text = element_text(size = 9, color = "black"))

pl
Conclusion
We not only observed the differences of Index between three groups but also found the prevalence of Index between three groups from the aforementioned figure.
Systemic information
devtools::session_info()
## ─ Session info ───────────────────────────────────────────────────────────────
##  setting  value
##  version  R version 4.1.3 (2022-03-10)
##  os       macOS Big Sur/Monterey 10.16
##  system   x86_64, darwin17.0
##  ui       X11
##  language (EN)
##  collate  en_US.UTF-8
##  ctype    en_US.UTF-8
##  tz       Asia/Shanghai
##  date     2023-07-24
##  pandoc   3.1.3 @ /Users/zouhua/opt/anaconda3/bin/ (via rmarkdown)
##
## ─ Packages ───────────────────────────────────────────────────────────────────
##  package     * version date (UTC) lib source
##  blogdown      1.18    2023-06-19 [2] CRAN (R 4.1.3)
##  bookdown      0.34    2023-05-09 [2] CRAN (R 4.1.2)
##  bslib         0.5.0   2023-06-09 [2] CRAN (R 4.1.3)
##  cachem        1.0.8   2023-05-01 [2] CRAN (R 4.1.2)
##  callr         3.7.3   2022-11-02 [2] CRAN (R 4.1.2)
##  cli           3.6.1   2023-03-23 [2] CRAN (R 4.1.2)
##  colorspace    2.1-0   2023-01-23 [2] CRAN (R 4.1.2)
##  crayon        1.5.2   2022-09-29 [2] CRAN (R 4.1.2)
##  devtools      2.4.5   2022-10-11 [2] CRAN (R 4.1.2)
##  digest        0.6.33  2023-07-07 [1] CRAN (R 4.1.3)
##  dplyr       * 1.1.2   2023-04-20 [2] CRAN (R 4.1.2)
##  ellipsis      0.3.2   2021-04-29 [2] CRAN (R 4.1.0)
##  evaluate      0.21    2023-05-05 [2] CRAN (R 4.1.2)
##  fansi         1.0.4   2023-01-22 [2] CRAN (R 4.1.2)
##  farver        2.1.1   2022-07-06 [2] CRAN (R 4.1.2)
##  fastmap       1.1.1   2023-02-24 [2] CRAN (R 4.1.2)
##  forcats     * 1.0.0   2023-01-29 [2] CRAN (R 4.1.2)
##  fs            1.6.2   2023-04-25 [2] CRAN (R 4.1.2)
##  generics      0.1.3   2022-07-05 [2] CRAN (R 4.1.2)
##  ggplot2     * 3.4.2   2023-04-03 [2] CRAN (R 4.1.2)
##  glue          1.6.2   2022-02-24 [2] CRAN (R 4.1.2)
##  gtable        0.3.3   2023-03-21 [2] CRAN (R 4.1.2)
##  highr         0.10    2022-12-22 [2] CRAN (R 4.1.2)
##  hms           1.1.3   2023-03-21 [2] CRAN (R 4.1.2)
##  htmltools     0.5.5   2023-03-23 [2] CRAN (R 4.1.2)
##  htmlwidgets   1.6.2   2023-03-17 [2] CRAN (R 4.1.2)
##  httpuv        1.6.11  2023-05-11 [2] CRAN (R 4.1.3)
##  jquerylib     0.1.4   2021-04-26 [2] CRAN (R 4.1.0)
##  jsonlite      1.8.7   2023-06-29 [2] CRAN (R 4.1.3)
##  knitr         1.43    2023-05-25 [2] CRAN (R 4.1.3)
##  labeling      0.4.2   2020-10-20 [2] CRAN (R 4.1.0)
##  later         1.3.1   2023-05-02 [2] CRAN (R 4.1.2)
##  lifecycle     1.0.3   2022-10-07 [2] CRAN (R 4.1.2)
##  lubridate   * 1.9.2   2023-02-10 [2] CRAN (R 4.1.2)
##  magrittr      2.0.3   2022-03-30 [2] CRAN (R 4.1.2)
##  memoise       2.0.1   2021-11-26 [2] CRAN (R 4.1.0)
##  mime          0.12    2021-09-28 [2] CRAN (R 4.1.0)
##  miniUI        0.1.1.1 2018-05-18 [2] CRAN (R 4.1.0)
##  munsell       0.5.0   2018-06-12 [2] CRAN (R 4.1.0)
##  pillar        1.9.0   2023-03-22 [2] CRAN (R 4.1.2)
##  pkgbuild      1.4.2   2023-06-26 [2] CRAN (R 4.1.3)
##  pkgconfig     2.0.3   2019-09-22 [2] CRAN (R 4.1.0)
##  pkgload       1.3.2.1 2023-07-08 [2] CRAN (R 4.1.3)
##  prettyunits   1.1.1   2020-01-24 [2] CRAN (R 4.1.0)
##  processx      3.8.2   2023-06-30 [2] CRAN (R 4.1.3)
##  profvis       0.3.8   2023-05-02 [2] CRAN (R 4.1.2)
##  promises      1.2.0.1 2021-02-11 [2] CRAN (R 4.1.0)
##  ps            1.7.5   2023-04-18 [2] CRAN (R 4.1.2)
##  purrr       * 1.0.1   2023-01-10 [2] CRAN (R 4.1.2)
##  R6            2.5.1   2021-08-19 [2] CRAN (R 4.1.0)
##  Rcpp          1.0.11  2023-07-06 [1] CRAN (R 4.1.3)
##  readr       * 2.1.4   2023-02-10 [2] CRAN (R 4.1.2)
##  remotes       2.4.2   2021-11-30 [2] CRAN (R 4.1.0)
##  rlang         1.1.1   2023-04-28 [2] CRAN (R 4.1.2)
##  rmarkdown     2.23    2023-07-01 [2] CRAN (R 4.1.3)
##  rstudioapi    0.15.0  2023-07-07 [2] CRAN (R 4.1.3)
##  sass          0.4.6   2023-05-03 [2] CRAN (R 4.1.2)
##  scales        1.2.1   2022-08-20 [2] CRAN (R 4.1.2)
##  sessioninfo   1.2.2   2021-12-06 [2] CRAN (R 4.1.0)
##  shiny         1.7.4.1 2023-07-06 [2] CRAN (R 4.1.3)
##  stringi       1.7.12  2023-01-11 [2] CRAN (R 4.1.2)
##  stringr     * 1.5.0   2022-12-02 [2] CRAN (R 4.1.2)
##  tibble      * 3.2.1   2023-03-20 [2] CRAN (R 4.1.2)
##  tidyr       * 1.3.0   2023-01-24 [2] CRAN (R 4.1.2)
##  tidyselect    1.2.0   2022-10-10 [2] CRAN (R 4.1.2)
##  tidyverse   * 2.0.0   2023-02-22 [1] CRAN (R 4.1.2)
##  timechange    0.2.0   2023-01-11 [2] CRAN (R 4.1.2)
##  tzdb          0.4.0   2023-05-12 [2] CRAN (R 4.1.3)
##  urlchecker    1.0.1   2021-11-30 [2] CRAN (R 4.1.0)
##  usethis       2.2.2   2023-07-06 [2] CRAN (R 4.1.3)
##  utf8          1.2.3   2023-01-31 [2] CRAN (R 4.1.2)
##  vctrs         0.6.3   2023-06-14 [1] CRAN (R 4.1.3)
##  withr         2.5.0   2022-03-03 [2] CRAN (R 4.1.2)
##  xfun          0.39    2023-04-20 [2] CRAN (R 4.1.2)
##  xtable        1.8-4   2019-04-21 [2] CRAN (R 4.1.0)
##  yaml          2.3.7   2023-01-23 [2] CRAN (R 4.1.2)
##
##  [1] /Users/zouhua/Library/R/x86_64/4.1/library
##  [2] /Library/Frameworks/R.framework/Versions/4.1/Resources/library
##
## ──────────────────────────────────────────────────────────────────────────────
Hua Zou
Senior Bioinformatic Analyst
My research interests include host-microbiota intersection, machine learning and multi-omics data integration.