Differential Analysis
Notebook 5 Differential Analysis.
There are 152 species in our dataset. In order to clinically interpret the potential biomarkers identified by the next step in machine learning, we perform the differential analysis to figure out the significant species as the inputs for building models. The method and criterion are as follows:
- T-test based on CLR tranformed data;
- Pvalue or Adjusted-Pvalue is less than 0.05;
the absolute values of Log2Foldchange on Mean values is more than 1.
Goal
Find the significant features of the data and choose them for machine learning.
Loading data and essential libraries
import pandas as pd
import numpy as np
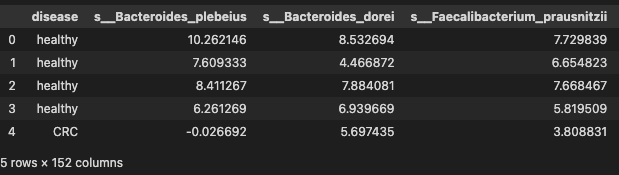
data_df = pd.read_table('./dataset/MergeData_clr.tsv', sep="\t", index_col=0)
data = data_df.reset_index(drop=True)
data.head()
T test
Since profile are CLR transformed data, we choose t test to identify the significant species
from itertools import combinations
from scipy import stats as st
def all_pairwise(df, compare_col = 'disease'):
decade_pairs = [(i, j) for i, j in combinations(df[compare_col].unique().tolist(), 2)]
# or add a list of colnames to function signature
cols = list(df.columns)
cols.remove(compare_col)
list_of_dfs = []
for pair in decade_pairs:
for col in cols:
c1 = df[df[compare_col] == pair[0]][col]
c2 = df[df[compare_col] == pair[1]][col]
results = st.ttest_ind(c1, c2, nan_policy='omit')
tmp = pd.DataFrame({'dec1': pair[0],
'dec2': pair[1],
'tstat': results.statistic,
'pvalue': results.pvalue}, index = [col])
list_of_dfs.append(tmp)
df_stats = pd.concat(list_of_dfs)
return df_stats
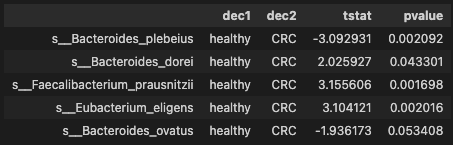
ttest_res = all_pairwise(data)
ttest_res.head()
- FDR correction
def correct_pvalues_for_multiple_testing(pvalues, correction_type = "Benjamini-Hochberg"):
"""
consistent with R - print correct_pvalues_for_multiple_testing([0.0, 0.01, 0.029, 0.03, 0.031, 0.05, 0.069, 0.07, 0.071, 0.09, 0.1])
"""
from numpy import array, empty
pvalues = array(pvalues)
#n = float(pvalues.shape[0])
n = pvalues.shape[0]
new_pvalues = empty(n)
if correction_type == "Bonferroni":
new_pvalues = n * pvalues
elif correction_type == "Bonferroni-Holm":
values = [ (pvalue, i) for i, pvalue in enumerate(pvalues) ]
values.sort()
for rank, vals in enumerate(values):
pvalue, i = vals
new_pvalues[i] = (n-rank) * pvalue
elif correction_type == "Benjamini-Hochberg":
values = [ (pvalue, i) for i, pvalue in enumerate(pvalues) ]
values.sort()
values.reverse()
new_values = []
for i, vals in enumerate(values):
rank = n - i
pvalue, index = vals
new_values.append((n/rank) * pvalue)
for i in range(0, int(n)-1):
if new_values[i] < new_values[i+1]:
new_values[i+1] = new_values[i]
for i, vals in enumerate(values):
pvalue, index = vals
new_pvalues[index] = new_values[i]
return new_pvalues
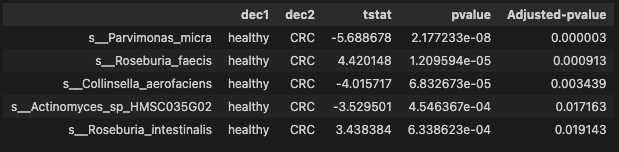
ttest_res['Adjusted-pvalue'] = correct_pvalues_for_multiple_testing(ttest_res['pvalue'], correction_type = "Benjamini-Hochberg")
ttest_res_sort = ttest_res.sort_values(by='Adjusted-pvalue')
ttest_res_sort.head()
- Significant species with pvalue less than 0.05
threshold = 0.05 # pvalue or Adjusted-pvalue
signif_species = ttest_res_sort.loc[ttest_res_sort['pvalue'] < threshold]
signif_species.shape
(40, 5)
There are 40 significant species identified by pvalue between CRC and healthy group
Output
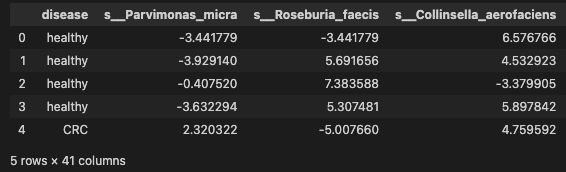
Selecting the 40 species profile to downstream analysis
data_signif = pd.concat([data['disease'], data[signif_species.index.tolist()]], axis=1)

data_signif.to_csv('./dataset/MergeData_clr_signif.tsv',
            sep='\t', encoding='utf-8', index=True)

data_signif.head()
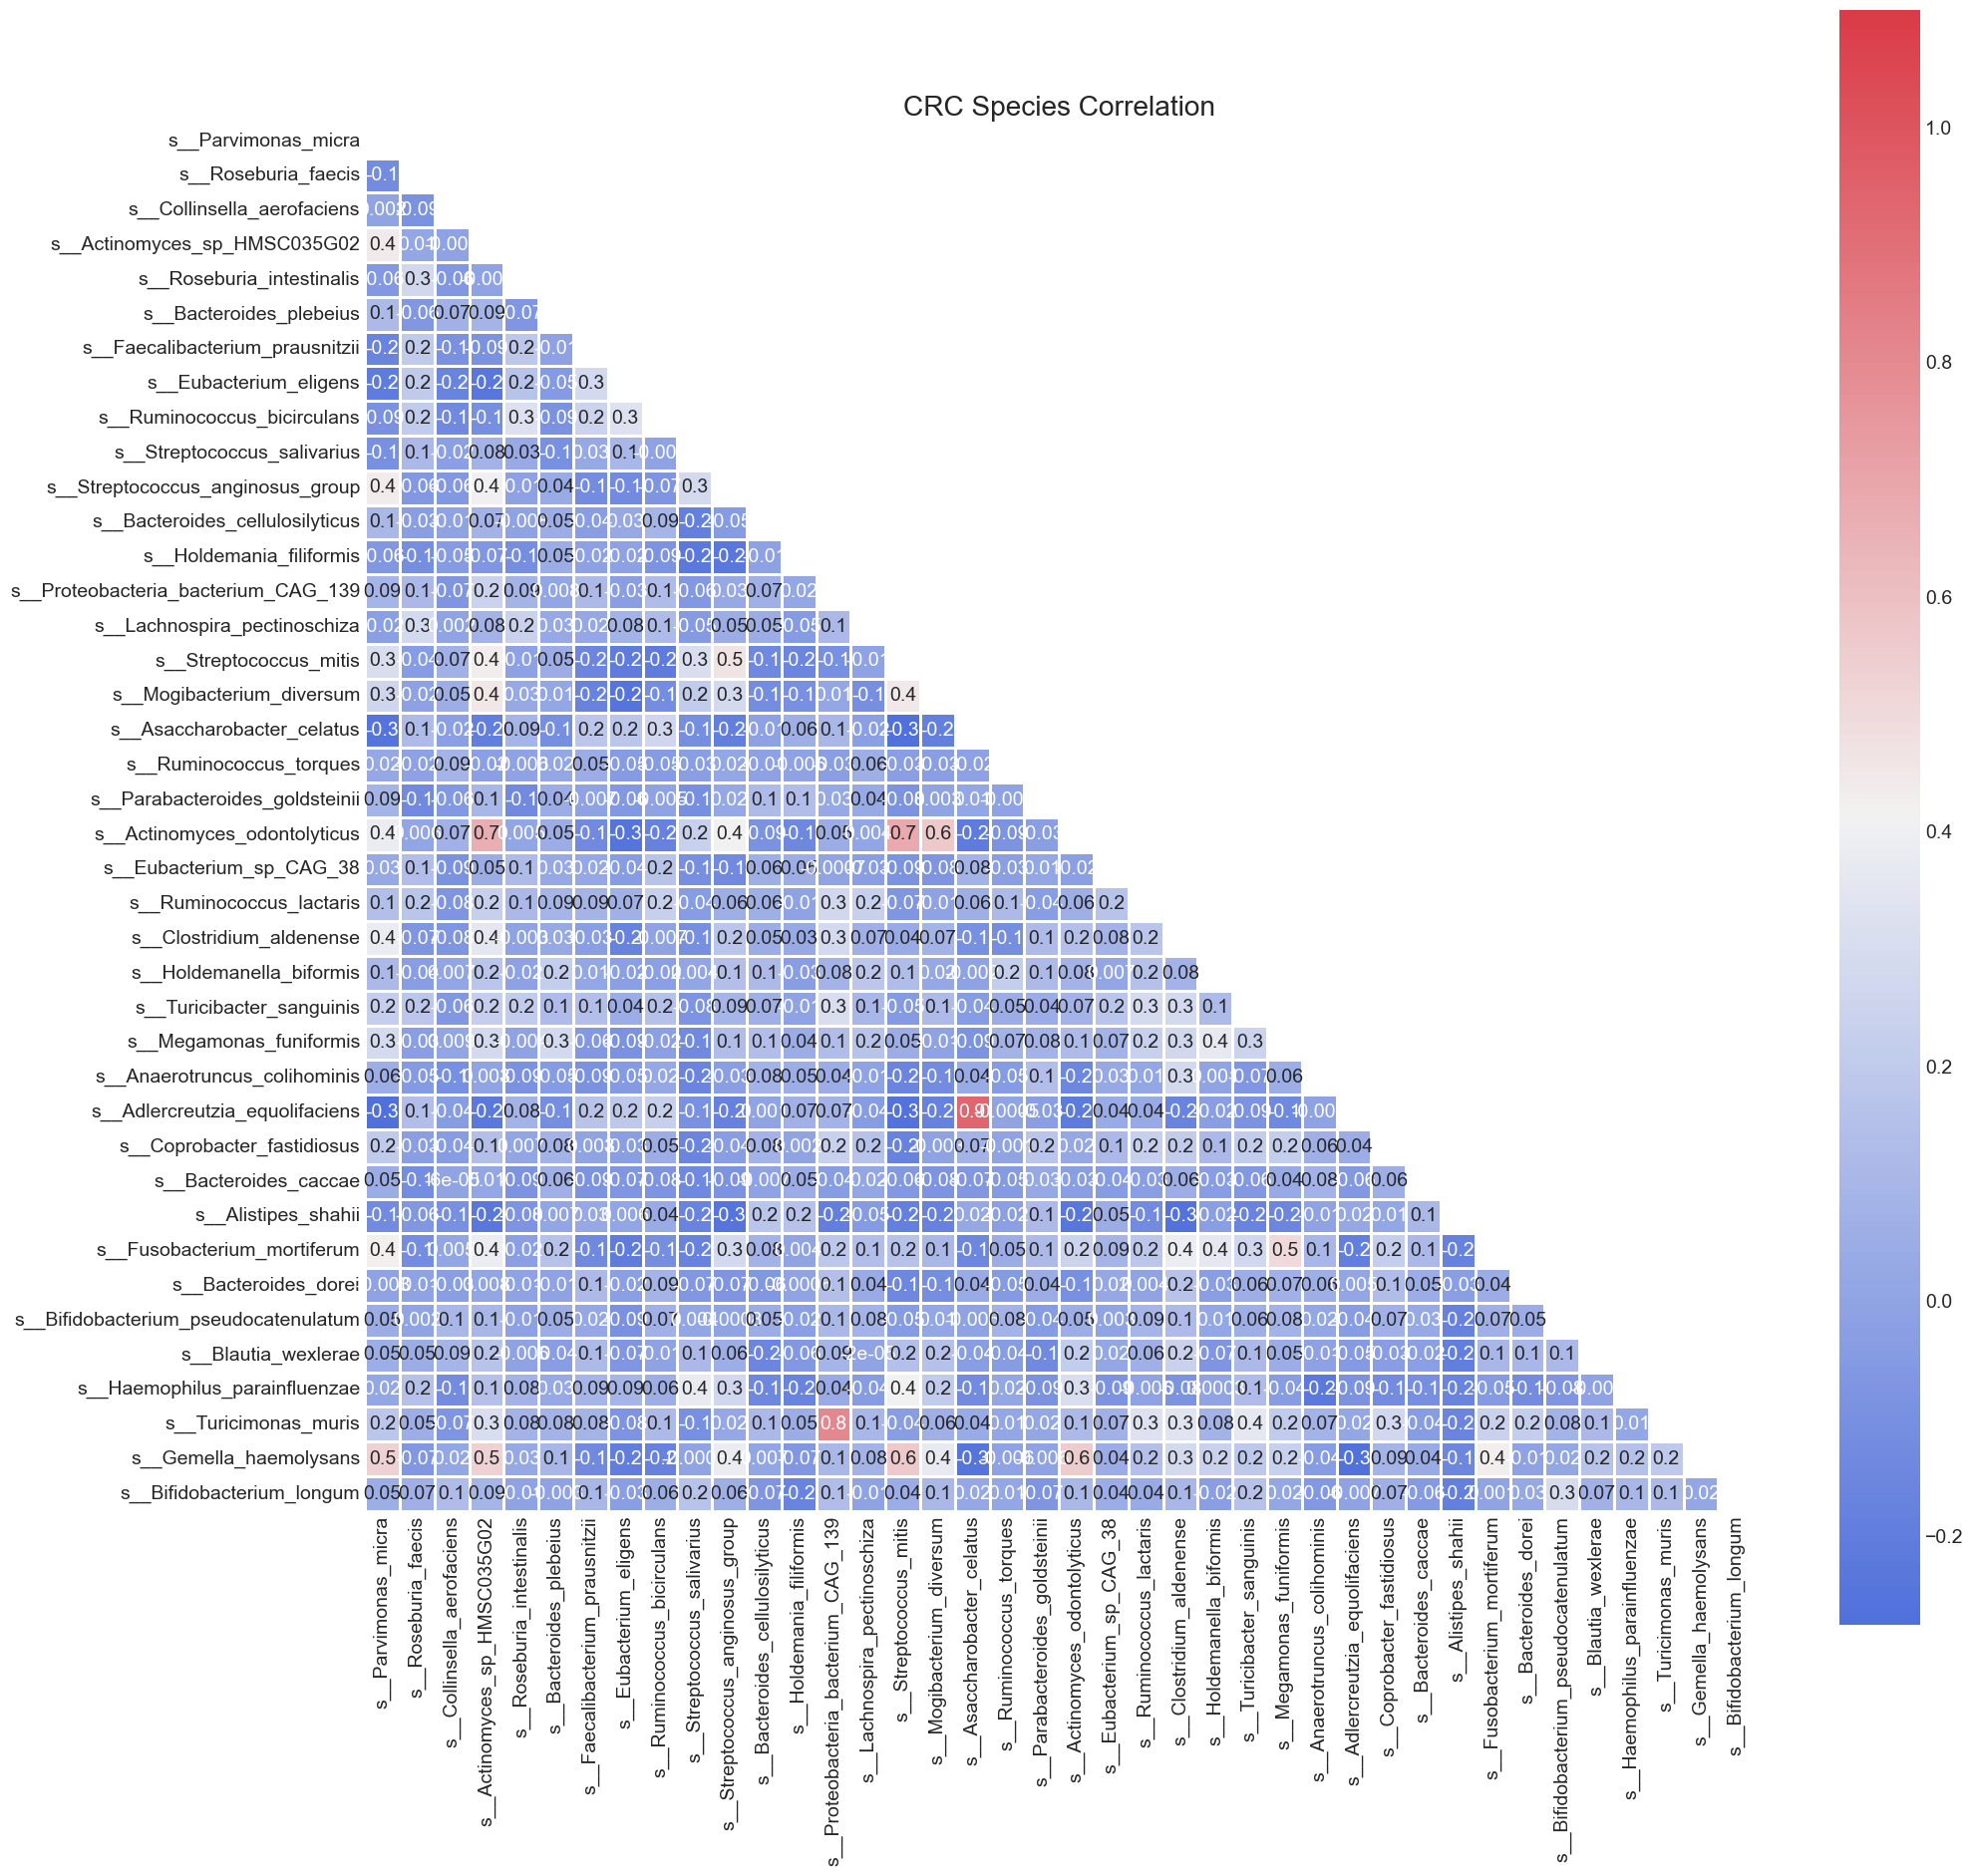
correlation matrix
# plot correlation matrix
import pandas as pd
import numpy as np
import seaborn as sns
from matplotlib import pyplot as plt

plt.style.use('fivethirtyeight')
sns.set_style("white")

# Compute the correlation matrix
data_species = data_signif.iloc[:, 1:data_signif.shape[1]]
corr = data_species.corr(method="spearman")

# Generate a mask for the upper triangle
mask = np.zeros_like(corr, dtype='bool')
mask[np.triu_indices_from(mask)] = True

# Set up the matplotlib figure
fig, ax = plt.subplots(figsize=(20, 20))
plt.title('CRC Species Correlation')

# Generate a custom diverging colormap
cmap = sns.diverging_palette(260, 10, as_cmap=True)

# Draw the heatmap with the mask and correct aspect ratio
sns.heatmap(corr,
            vmax=1.1,
            square='square',
            cmap=cmap,
            mask=mask,
            ax=ax,
            annot=True,
            fmt='.1g',
            linewidths=2)
A Summary of the significant species here:
- t-test on microbiota data
- FDR correction on pvalue of t-test
- obtain significant species